Hyndburn district
This summary offers a snapshot of some of the most important economic, social and environmental factors in Hyndburn district with links through to the source information. The information has been allocated to one of seven themes: 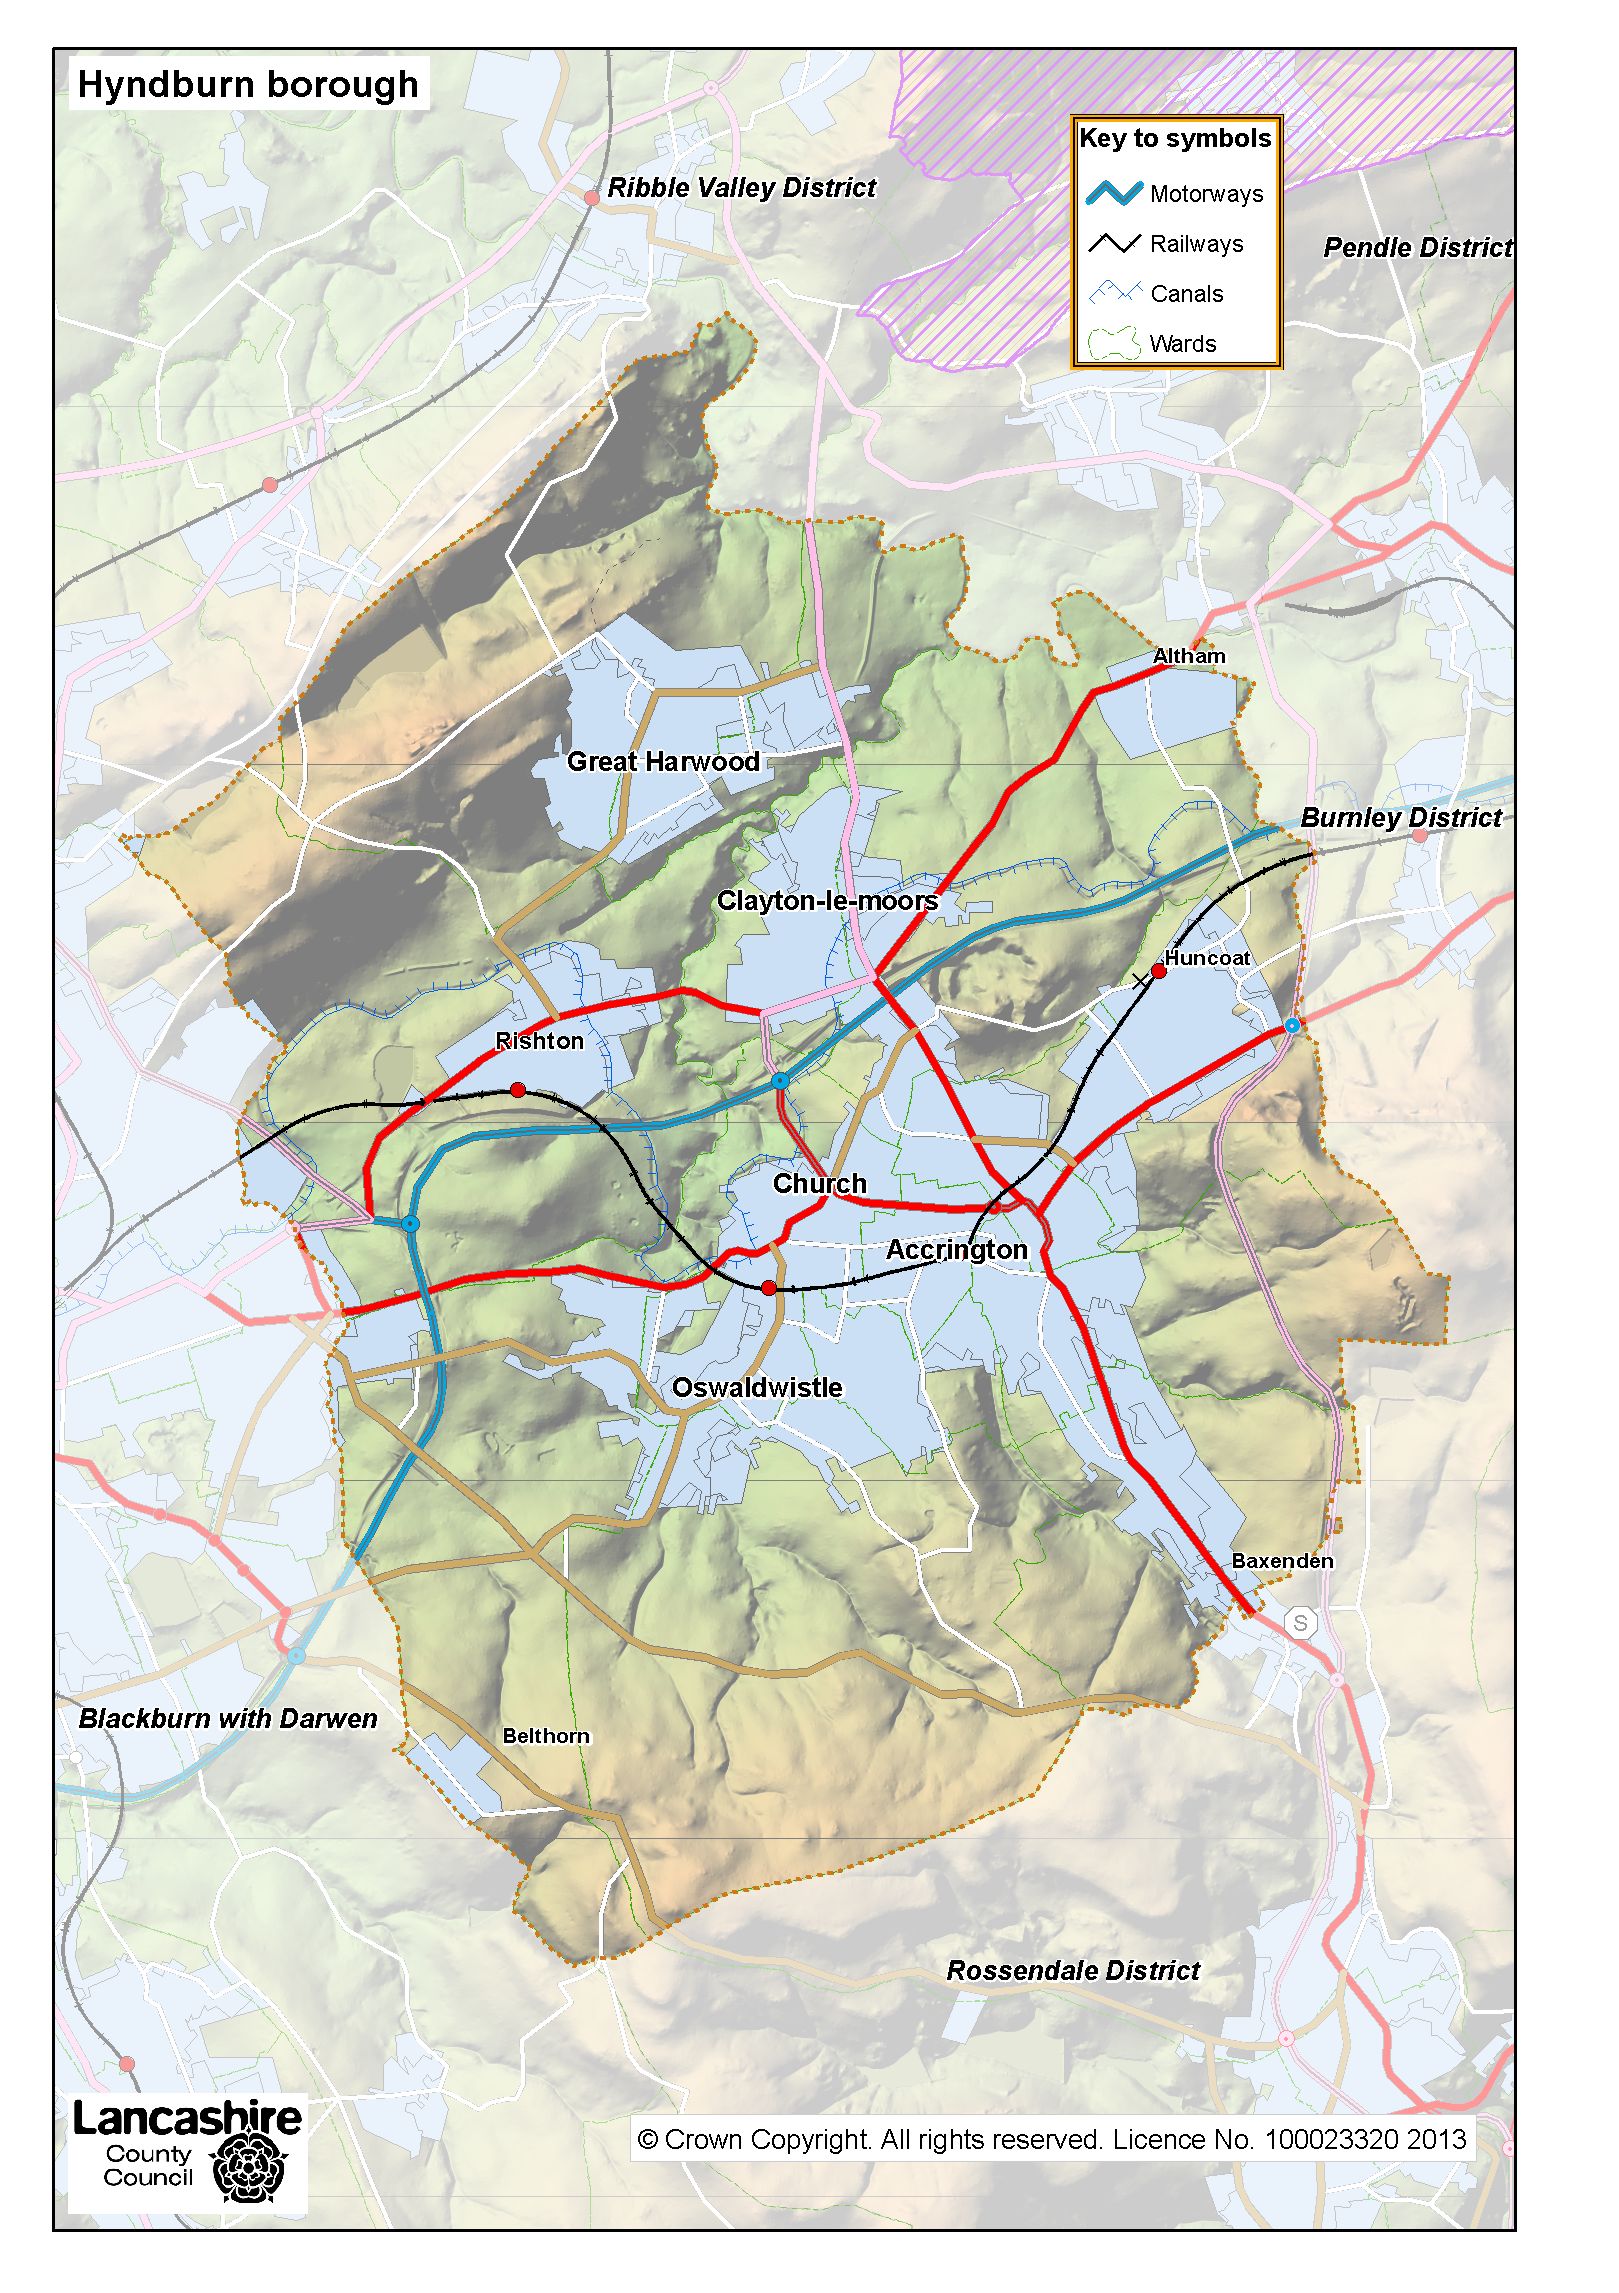
- Children and Young People
- People and Communities
- Economic Development
- Community Safety
- Environment and Transport
- Health and Wellbeing
- Older People
Introduction
Hyndburn is an authority in East Lancashire that covers 73 square kilometres, has 16 wards, and the number of people per km² is around three times the England and Wales average. From an historic point of view there have been dramatic changes and the pace of future change is liable to increase.
There are 47 schools in Hyndburn, of these 36 are primary and 6 secondary. A full list of schools in Lancashire is available (downloads a Microsoft Excel file). Ofsted inspection reports and the GOV.UK web page on schools performance are useful sources of local information, although the latter is defined for Hyndburn parliamentary constituency and so includes some in Rossendale.
Key stage 4 covers the two years of school education that incorporates GCSEs in maintained schools. A new secondary school GCSE accountability system was implemented in 2016, in which 'Attainment 8' measures achievement in maths and English plus other subjects with less weighting. The Attainment 8 average score was 41.2 in Hyndburn district in 2023/24. This was the third lowest in the Lancashire County Council area, where the overall average was 44.9. At Key stage 1 level Hyndburn had the poorest results in the Lancashire-12 area in 2021/22 but as results from the new phonic screening checks are not published at local authority district level it is no longer possible to draw comparisons.
For young children and parents the county council's Children and Family Wellbeing Service has a search facility for local centres. The four in the district are the Great Harwood Children and Family Wellbeing Services, New Era Family Hub and the Zone. Rishton Children and Family Wellbeing Services and the Park Family Hub.
The Lancashire Insight page on the School Census lists all schools in Hyndburn district. Ofsted inspection reports are a useful source of local information.
Only a relatively small number of families in Hyndburn have an income level that led to them opting out of receiving child benefit. There were also the fourth highest number of children in low income families amongst the Lancashire-12 authorities in the 2022/23 financial year with 7,920.
The county council's Young People's Service website has an activity and organisations search facility that lists a wide range of options for young people in each of the 12 districts within the county council area.
Business Intelligence and Public Health analysts at Lancashire County Council have produced Child health profiles for districts in Lancashire, including both district and ward elements for Hyndburn, and bringing together key indicators from Fingertips, the public health data collection from the Office for Health Improvement & Disparities (OHID).
The mid 2024 population estimate for the authority was 86,058. One of the Census outputs still available is an interactive tool that compares the 2021 results with 2011 for local authorities. The population in the authority, like other authorities in East Lancashire, was affected by negative migration until around 2013, since when there has been a strong recovery. The authority has a tendency towards a younger population and fewer people of pensionable age than is the average for England and Wales. The ethnic mix is similar to other authorities in East Lancashire, predominantly white. The largest minority ethnic group is Pakistani.
The total fertility rate can be used as an estimate of the fertility growth factor in the population. The rate in Hyndburn of 1.73 for 2024 was one of the highest in Lancashire and well above the England average of 1.42.
Local authority live births and deaths graphs are available that track changes in births and deaths since the 1980s for each authority in Lancashire. The graph for Hyndburn reveals that over the long-term, live births have exceeded deaths in all but four years, one of which is 2023. Because of the Covid-19 pandemic most districts had more deaths than births in 2020. The number of deaths in each month of 2021 to 2024 can be seen in the monthly mortality graph slide on the Lancashire Insight Covid-19 intelligence web page.

It is estimated that between 2022 and 2047 the population of Hyndburn will increase by 6%, much lower than the 12% increase expected for Lancashire-14, and the 12.7% rise predicted for England as a whole. The projected number of households in the authority is forecast to grow by 8.9% between 2018 and 2043, the third lowest percentage increase in the Lancashire-12 area, and is well below the England (16.2%) average.
Hyndburn has around 37,600 dwellings, 87% are owner occupied or private rented. Hyndburn, like other East Lancashire authorities, has a very high proportion of its housing stock in council tax band A. The authority also has a high percentage of vacant dwellings.
The median house price to earnings ratio in the authority is very low.
A total of 18.4% of households in Hyndburn were in fuel poverty in 2022, the 4th highest in the Lancashire-14 area and the 22nd highest in England. Factors that determine fuel poverty are the energy efficiency status of the property, the cost of energy, and household income.
The 2025 Indices of Deprivation reveals that Hyndburn was the 16th most deprived area out of 296 districts and unitary authorities in England, by the rank of average rank measure. In total. 32.1% of the lower super output areas in the authority were in the 10% most deprived in the country.
ONS has produced a set of residential-based area classifications using analysis of the 2021 Census. These are for very small statistical areas, but we have identified the most common groups for the electoral wards. Residents in six of Hyndburn's wards mostly fit into the 'Legacy Industrial and Coastal Communities' group, those in another three wards the 'Young Families in Industrial Towns' group and in a further three wards the 'Challenged Multicultural Communities and Students' group. It is the last mentioned group that best represents the district as a whole.
In contrast to the national and county growth, employee numbers in Hyndburn were static in the decade to 2008, whilst between 2009 and 2022 the employment numbers in the authority were in the 28,000 to 29,000 range and rose to 31,000 in 2023.
In Hyndburn as in most places, the manufacturing sector has shed jobs over the years whilst the service sector has grown to become a far greater source of employee jobs. However there still continues to be a bias towards a larger proportion of employees in the manufacturing sector in Lancashire and Hyndburn than is the national norm and a lower proportion of jobs in the service sector.
Warehousing development has been an important contributor to employment growth in Lancashire in recent years and the area has strong concentrations of warehousing floorspace around along the M65 corridor. Employee numbers in the wholesale, retail and motor trade sector reflect this. There is currently a small employment presence in the public administration, defence and compulsory social security sector.
Our extensive employment records allow us to monitor the changes to employee numbers from 1929 onwards. We have published separate graphs for each of the 14 Lancashire local authorities that reveal changes in total employee numbers and the shift from manufacturing to service sector employment. Methodological changes, and assumptions for missing years, reduce the accuracy of the graphs, but they do give a useful broad indication of changes over time. The long-term jobs graph for Hyndburn indicates that the employment total in the authority was at its highest in 1929.

The percentage of workless households is reasonably high in the authority.
In 2025, there were only 2,405 active enterprises in Hyndburn, the lowest figure of all 14 Lancashire authorities. Just over two thousand of the enterprises had fewer than ten employees. 265 had between 10 and 49 employees and were classed as small enterprises, while only around 10 employed more than 250.
Five companies in Hyndburn have won recent King's (formerly Queen's) Award for Enterprise. Most recently, FPW Axles Limited and Premier Tooling Systems Limited, both based in Accrington were winners in 2020. Universal Smart Cards Limited, makers of smart cards and related smart card products and also based in Accrington won the Queen's Award for International Trade for Outstanding Short Term Growth in overseas sales in 2019. BMP Europe Ltd, also located in Accrington, are manufacturers of an extensive range of engineered textile & polyurethane elastomer products. They won the award for international trade in 2012. Langtec Ltd., also based in Accrington are manufacturers of insulating products also won in the international trade category in 2012.
The M65 has improved access to the area and a number of new business locations have been developed close to motorway junctions.
Assisted areas were places where regional aid could be offered to undertakings, typically businesses, under European Union state aid rules. From 2014 to 2020 Hyndburn had seven wards with assisted area status. Following the departure of the UK from the European Union these rules no longer apply and a Subsidy control act was passed in 2022. There is now a facility to search for publicly subsidised schemes.
Hyndburn has a localised labour market, with 51% having journeys to work of less than 5km (compared to 40% nationally). This may be related to some cultural attitudes, whereby residents with low wages, poor skills and low aspirations will only travel limited distances for employment opportunities. Strongest commuting flows are to and from Blackburn. The 2021 census commuter flow results between local authorities revealed that 5,218 Hyndburn residents commuted to work in Blackburn with Darwen on census day.
Average earnings in Hyndburn are low when measured by place of work which is around £44 less than by place of residence. Figures from HM Revenue and Customs on personal incomes provide an annual estimate for the average income of individuals who pay income tax. According to these figures, the median total personal income in Hyndburn is statistically similar to the Lancashire-12 average.
There is a high level of employment and support allowance claimants. In comparison to the national average, there is a high percentage of the working age population that is reliant on welfare benefits.
In December 2019 it was announced that training and support will be given by the High Streets Task Force to a pilot project to improve Accrington Town Centre, with up to £25 million from the Future High Streets Fund. A bid to access this fund the following year proved unsuccessful, but in 2023 the 'Accrington Acre' programme was successful in a bid to the Levelling Up Fund.
The recorded crime article for Hyndburn crime rate was just above the average for the Lancashire-14 area. See the LG Inform Quarterly Report on Crime and Disorder by Local Authority.
For more details on community safety in your neighbourhood, please enter your postcode or ward into the window in the Local area community safety statistics web page.
Alcohol is known to contribute to offending behaviour, particularly violence, anti-social behaviour and criminal damage. Residents in the authority have significantly worse number of hospital stays due to alcohol than the national average according to the LAPE (Local Alcohol Profiles for England).
In 2023, a total of 64 people in the authority were killed or seriously injured in road traffic collisions.
Transport has a key role to play in realising the economic potential of an area by unlocking key locations, such as the existing and new locations referred to in the economy section. Using sustainable transport modes can significantly improve employment opportunities and life chances. In urban areas the reliance on the car presents problems of traffic congestion and reduced air quality. The latest air pollution emission results show high levels of the two pollutants NOx (8.2 tonnes per annum per square km) and particulates (1.2 tonnes per annum per square km). In the Lancashire-14 area only Blackpool and South Ribble had higher average emissions of NOx and only Blackpool and Fylde had higher average emissions of particulates. Although an area in Altham ward scored very high on the Air Quality indicator element of the 2019 Indices of Deprivation, an indicator based on air pollution concentration levels, in 2025 this area scored relatively much lower, possibly due to changes in methodology.
The East Lancashire Highways and Transport Masterplan is the strategic transport document for the wider area and contains references to transport issues in the authority.
The Department for Transport website has an interactive map that lists the traffic flows at hundreds of sites across all of the Lancashire County Council area.
There are four railway stations in the authority area, of which the busiest is Accrington.
Maps are available that reveal the various rural-urban definitions across Lancashire down to the very small census output area level.
The National Biodiversity Network Gateway acts as a “data warehouse” for biodiversity information, which can be quickly and easily accessed to understand the distribution of particular species in the UK. Much of the local data is supplied by the Lancashire Environment Record Network (LERN), which is hosted by Lancashire County Council. An interactive map on this site shows the extent of the Environmental Record Centre coverage, including the LERN area, and when adding a species using the 'Add to Map' control, records of their sightings are displayed.
Green belts have been an enduring element of national planning policy. They check the unrestricted sprawl of large built-up areas; prevent neighbouring towns from merging into one another; assist in safeguarding the countryside, preserve the character of historic towns and encourage the recycling of derelict and other urban land. Hyndburn has a large proportion of land designated as green belt.
Lancashire County Council supports various projects in district authorities via a range of grants and funding options.
Total carbon dioxide emissions in Hyndburn are quite low in terms of both total tonnage and emissions per person. In 2019 the mortality rate attributed to poor air quality was higher in Hyndburn than any other authority in the Lancashire-14 area, but was still lower than the England average.
The household waste reuse, recycling and composting rate in Hyndburn was only 31.6%, while there were over 2,925 incidents of fly-tipping during 2023/24. Hyndburn had the 16th lowest rate in England for collected waste per person.
The legacy of former mine workings in the area was highlighted in 2015, when the coal authority published development risk plans and specific risk plans that included a set for Hyndburn district.
Figures for life expectancy at birth reveal that Hyndburn district had very low male and female averages in comparison to the national figures. The following graph reveals life expectancy changes in the authority by three-year time periods from 1991-93 onwards. The graph emphasises the growing disparities between the Hyndburn and national averages.

The Hyndburn Health Profile, published by Public Health England, reveals that the health of people in Hyndburn is generally worse than the England average.
The 2015 health behaviours summary report (PDF 447 KB) and lifestyle survey findings (PDF 957 KB) for Hyndburn provide further details on lifestyle behaviours such as smoking, drinking, substance use, physical activity, nutrition, excess weight and wellbeing.
In July 2022 Integrated Care Boards replaced the much smaller Clinical Commissioning Groups as clinically-led statutory NHS bodies responsible for the planning and commissioning of health care services for their local area, including the majority of the hospital and community NHS services. Together with their associated Integrated Care Partnerships, which includes representatives from the upper tier local authorities responsible for social care and public health, they form Integrated Care Systems (ICS). The single ICS covering the whole of the Lancashire-14 area is the Healthier Lancashire and South Cumbria ICS. That web page has a link to a glossary of the terms used and there is a further explanation on a Kings Fund web page.
Hospital services are provided by East Lancashire Hospitals NHS Trust. There are various health centres and clinics.
The local government association has produced 'housing, health and wellbeing profiles' for each local authority across the country. The figures go down to the ward level, and the Hyndburn profile has results from the census, the index of multiple deprivation and other data sources.
Public Health England has produced Cardiovascular disease profiles for each of the former clinical commissioning groups in England, in this case NHS East Lancashire CCG. There are separate reports for heart disease, stroke, diabetes and kidney disease.
The authority has relatively few State Pension claimants. In the county as a whole; the highest concentrations are found in selected areas along the coast. Pension Credit is for pensioners at the lower end of the income scale and the caseload in the authority is relatively high in comparison to the number of pensioners.
It has been well documented over recent years that people are living longer and that the older age-groups will record some dramatic increases over future years, with associated financial implications and demand for health and social care services. By 2047, the population aged 65 or over in Hyndburn is projected to increase to 19,016.
Attendance Allowance provides financial help to people aged 65 or over who are physically or mentally disabled. The caseload in November 2025 was 2,760. Housing benefit is being phased out, but latest figures show there were over 2,000 claimants in Hyndburn of which 70% were retired.
Life expectancy as mentioned earlier is increasing but there is no guarantee that the extra years of life will necessarily equate to extra years of healthy life expectancy. However, it is not a foregone conclusion that "extra" years of life expectancy should necessarily lead to additional years with ill health or disability. More suitable community services to enable independent living and more effective practice of preventive lifestyles and medicine has the potential to lengthen disability-free life expectancy, particularly in the case of the prevention and treatment of non-fatal but disabling diseases.
The Lancashire Care Homes Association is an organisation that represents care providers across the broader Lancashire area. The website lists a large number of care and nursing homes, along with domiciliary care agencies in the area. The details are listed by major urban localities across the county.
Page updated 28 May 2026