
Not in education, employment or training (NEET)
Overview and background information
The government has published a series of statistical releases that include NEET figures for local authorities. Data is available for the county council area, Blackburn with Darwen, Blackpool and the 12 districts comprising Lancashire.
The estimated NEET figures included in the following article should be viewed with caution, because of the young people classified to the 'unknown' category. These figures tend to be lower than those in the official statistical release on young people in England who are not participating in education or training because they: -
· only include young people who are known to their local authority (i.e. those who were educated in government-funded schools or state schools which provide education free of charge to pupils in England)
· do not count young people who are taking a gap year or are in custody as NEET
· depend on the quality of each local authority’s data collection.
Please note that the following statistics are also influenced by recent changes to the school leaving age. To help address this issue, the minimum age at which young people in England can leave learning has been increased. From summer 2013, young people were required to continue in education or training to the end of the academic year in which they turn 17, and from summer 2015 they were required to stay until their 18th birthday. The options for young people post-16 are either full-time education in a school or college; an apprenticeship; part-time accredited learning if they are in full-time employment; or volunteering.
Unemployment is high on the government agenda and in particular the impact of the recession on young people who are not in education, employment or training (NEET). It is widely recognised that a period of NEET can be associated with negative outcomes in later life, including unemployment, reduced earnings, poor health and life satisfaction, which has an impact on both the individual and the economy.
Please note that the counting methodology for Lancashire -12 changed in September 2016. Before then, all 16-18 year olds were counted, however since September 2016, only 16-17 year olds have been counted.
NEET, 2025/26
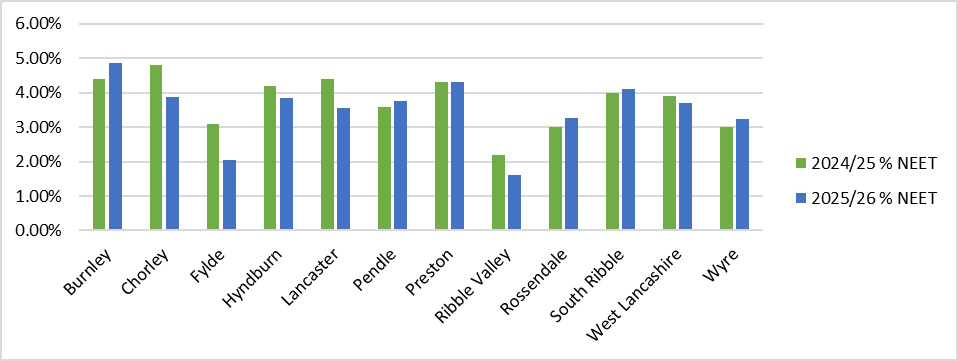
According to the latest figures, 3.7% of 16-17 year olds in Lancashire-12 were categorised as NEET (Table 1). This was lower than the regional rate of 4.3% and the respective neighbouring authority rate (6.7% in Blackpool), however was higher than the national rate of 3.4% and neighbouring authority Blackburn with Darwen rate of 3.6%. Within Lancashire-12, the percentage who are NEET varies between districts, from 1.6% in Ribble Valley to 4.9% in Burnley (Figure 1).
In 2025/26, the number and proportion of NEET in Lancashire-12 decreased by 0.2 percentage points (pp). NEET proportions increased in five of the Lancashire-12 districts, with South Ribble increasing to 4.1% (increase by 0.1pp), Pendle increased to 3.8% and Wyre increased to 3.2%, both increasing by 0.2pp and Rossendale increased to 3.3% (increase by 0.3pp). There was a notable increase for Burnley increasing by 0.5pp.
Table 1, Not in Education, employment or training, 2024/25 and 2025/26 (with count)
Lancashire-12 | Blackburn with Darwen | Blackpool | North West | England | |
2024/25 % | 3.9 | 4.7 | 7.6 | 4.3 | 3.4 |
2025/26 count | 1,125 | 180 | 225 | 7,950 | 46,520 |
2025/26 % | 3.7 | 3.6 | 6.7 | 4.3 | 3.4 |
Table A1
| Dec to Feb 3 month average performance | 2020/21 | 2020/21 | 2021/22 | 2021/22 | 2022/23 | 2022/23 | 2023/24 | 2023/24 | 2024/25 | 2024/25 | 2025/26 | 2025/26 |
| Area | No NEET | % NEET | No NEET | % NEET | No NEET | % NEET | No NEET | % NEET | No NEET | % NEET | No NEET | % NEET |
| Burnley | 57 | 2.60% | 75 | 3.20% | 71 | 3.00% | 76 | 3.10% | 117 | 4.40% | 134 | 4.90% |
| Chorley | 76 | 3.10% | 62 | 2.40% | 64 | 2.40% | 98 | 3.60% | 132 | 4.80% | 110 | 3.90% |
| Fylde | 26 | 1.80% | 23 | 1.50% | 32 | 2.10% | 45 | 3.00% | 50 | 3.10% | 33 | 2.00% |
| Hyndburn | 46 | 2.20% | 64 | 2.90% | 76 | 3.50% | 75 | 3.50% | 93 | 4.20% | 88 | 3.80% |
| Lancaster | 75 | 2.70% | 89 | 3.20% | 99 | 3.50% | 96 | 3.20% | 140 | 4.40% | 111 | 3.60% |
| Pendle | 51 | 2.20% | 46 | 1.80% | 56 | 2.10% | 75 | 2.90% | 102 | 3.60% | 111 | 3.80% |
| Preston | 115 | 3.40% | 128 | 3.60% | 101 | 2.70% | 135 | 3.50% | 172 | 4.30% | 180 | 4.30% |
| Ribble Valley | 13 | 1.00% | 19 | 1.40% | 18 | 1.30% | 16 | 1.20% | 31 | 2.20% | 24 | 1.60% |
| Rossendale | 45 | 2.80% | 33 | 2.00% | 47 | 2.70% | 51 | 2.80% | 57 | 3.00% | 61 | 3.30% |
| South Ribble | 83 | 3.40% | 72 | 2.90% | 67 | 2.70% | 99 | 3.80% | 109 | 4.00% | 113 | 4.10% |
| West Lancashire | 43 | 1.70% | 39 | 1.50% | 57 | 2.20% | 74 | 2.80% | 109 | 3.90% | 103 | 3.70% |
| Wyre | 50 | 2.20% | 40 | 1.80% | 46 | 2.00% | 66 | 2.80% | 75 | 3.00% | 82 | 3.20% |
| Lancashire-12 | 680 | 2.50% | 689 | 2.50% | 733 | 2.60% | 907 | 3.10% | 1,186 | 3.90% | 1,151 | 3.70% |
| Blackburn with Darwen | 111 | 2.60% | 133 | 3.10% | 156 | 3.50% | 183 | 4.00% | 226 | 4.70% | 180 | 3.60% |
| Blackpool | 143 | 4.40% | 152 | 4.60% | 196 | 7.00% | 213 | 7.00% | 245 | 7.60% | 225 | 6.70% |
| North West | 5,460 | 3.40% | 5,030 | 3.10% | 5,910 | 3.50% | 7,250 | 4.10% | 7,890 | 4.30% | 7,950 | 4.30% |
| England | 33,310 | 2.80% | 30,890 | 2.60% | 34,780 | 2.80% | 40,780 | 3.20% | 45,990 | 3.40% | 46,520 | 3.40% |
Figure 1: Young people NEET by district in Lancashire-12, 2024/25
Source: Children and Family Wellbeing Service (Young People's Service)
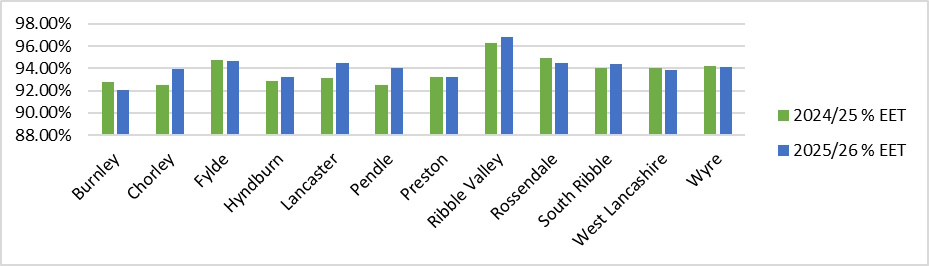
The percentage and number of young people in education, employment or training (EET) remained stable in Lancashire-12 overall at 93.95% (Table A2). The proportion of EET rose in seven of the Lancashire-12 districts, with percentages ranging from 92.09% in Burnley to 96.85% in Ribble Valley (Figure 2).
Table A2
| Dec to Feb 3 month average performance | 2020/21 | 2020/21 | 2021/22 | 2021/22 | 2022/23 | 2022/23 | 2023/24 | 2023/24 | 2024/25 | 2024/25 | 2025/26 | 2025/26 |
| Area | No EET | % EET | No EET | % EET | No EET | % EET | No EET | % EET | No EET | % EET | No EET | % EET |
| Burnley | 2,081 | 95.00% | 2,206 | 94.20% | 2,230 | 93.10% | 2,328 | 94.00% | 2,485 | 92.80% | 2,525 | 92.09% |
| Chorley | 2,342 | 93.90% | 2,459 | 95.10% | 2,524 | 95.60% | 2,582 | 94.00% | 2,564 | 92.50% | 2,658 | 93.98% |
| Fylde | 1,351 | 95.70% | 1,499 | 96.90% | 1,456 | 94.10% | 1,413 | 94.50% | 1,534 | 94.80% | 1,531 | 94.70% |
| Hyndburn | 1,965 | 93.50% | 2,038 | 94.00% | 2,045 | 93.90% | 2,020 | 93.10% | 2,041 | 92.90% | 2,139 | 93.20% |
| Lancaster | 2,571 | 92.90% | 2,576 | 92.80% | 2,689 | 93.70% | 2,781 | 93.90% | 2,948 | 93.10% | 2,953 | 94.50% |
| Pendle | 2,135 | 94.30% | 2,371 | 95.50% | 2,478 | 95.30% | 2,488 | 94.70% | 2,589 | 92.50% | 2,770 | 94.06% |
| Preston | 3,112 | 93.00% | 3,329 | 93.50% | 3,482 | 93.70% | 3,620 | 93.70% | 3,737 | 93.20% | 3,887 | 93.25% |
| Ribble Valley | 1,286 | 97.00% | 1,298 | 97.10% | 1,303 | 97.30% | 1,338 | 97.10% | 1,377 | 96.30% | 1,434 | 96.85% |
| Rossendale | 1,498 | 93.90% | 1,569 | 95.30% | 1,654 | 94.80% | 1,684 | 94.00% | 1,782 | 94.90% | 1,764 | 94.45% |
| South Ribble | 2,296 | 94.50% | 2,369 | 95.80% | 2,388 | 95.20% | 2,458 | 93.60% | 2,549 | 94.00% | 2,611 | 94.36% |
| West Lancashire | 2,376 | 95.00% | 2,408 | 95.60% | 2,485 | 95.70% | 2,508 | 94.90% | 2,611 | 94.00% | 2,617 | 93.84% |
| Wyre | 2,118 | 94.60% | 2,147 | 94.40% | 2,188 | 95.20% | 2,236 | 94.20% | 2,341 | 94.20% | 2,381 | 94.15% |
| Lancashire-12 | 25,131 | 94.20% | 26,269 | 94.80% | 26,921 | 94.70% | 27,457 | 94.20% | 28,556 | 93.60% | 29,269 | 93.95% |
| Blackburn with Darwen | 4,137 | 96.20% | 4,156 | 96.10% | 4,306 | 95.70% | 4,411 | 95.30% | 4,580 | 94.90% | 4,741 | 93.33% |
| Blackpool | 2,953 | 91.10% | 3,049 | 93.40% | 2,472 | 88.90% | 2,810 | 91.70% | 2,924 | 91.10% | 2,886 | 86.07% |
| Lancashire-14 | 32,221 | 94.20% | 334,737 | 94.80% | 33,699 | 94.40% | 34,679 | 94.10% | 36,060 | 93.50% | 36,896 | 91.40% |
| North West | 151,730 | 94.70% | 156,470 | 95.10% | 160,640 | 94.70% | 165,990 | 94.40% | 172,520 | 94.30% | 171,190 | 91.40% |
| England | 1,116,370 | 94.50% | 1,151,300 | 95.30% | 1,171,480 | 94.80% | 1,209,230 | 94.60% | 1,260,160 | 94.40% | 1,254,650 | 92.00% |
Figure 2: Young people in EET by district in Lancashire-12, 2025/26
Source: Children and Family Wellbeing Service (Young People's Service)
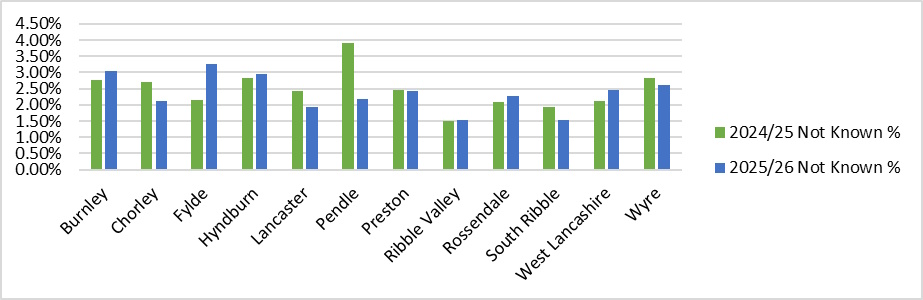
The percentage of instances where it was not known whether young people were involved in education, employment or training decreased in Lancashire-12 in 2025/26 to 2.35%. Lancashire-12 saw increases in six of its districts, with the highest increase being Fylde at 3.26% (increase of 1.12pp) and the lowest increase being Ribble Valley at 1.53% (increase of 0.04pp). The rest of Lancashire-12 saw decreases, the highest decrease being Pendle at 2.17% (decrease of 1.74pp) and the lowest decrease being Preston at 2.43% (decrease of 0.04pp).
Table A3
| Dec to Feb 3 month average performance | 2020/21 | 2020/21 | 2021/22 | 2021/22 | 2022/23 | 2022/23 | 2023/24 | 2023/24 | 2024/25 | 2024/25 | 2025/26 | 2025/26 |
| Area | Not Known | Not Known % | Not Known | Not Known % | Not Known | Not Known % | Not Known | Not Known % | Not Known | Not Known % | Not Known | Not Known % |
| Burnley | 54 | 2.40% | 61 | 2.60% | 94 | 3.90% | 72 | 2.90% | 74 | 2.76% | 83 | 3.04% |
| Chorley | 77 | 3.10% | 64 | 2.50% | 53 | 2.00% | 66 | 2.40% | 75 | 2.72% | 60 | 2.13% |
| Fylde | 35 | 2.50% | 25 | 1.60% | 60 | 3.90% | 38 | 2.50% | 35 | 2.14% | 53 | 3.26% |
| Hyndburn | 88 | 4.20% | 65 | 3.00% | 57 | 2.60% | 74 | 3.40% | 62 | 2.84% | 68 | 2.96% |
| Lancaster | 121 | 4.40% | 110 | 4.00% | 81 | 2.80% | 83 | 2.80% | 77 | 2.44% | 60 | 1.93% |
| Pendle | 79 | 3.50% | 67 | 2.70% | 65 | 2.50% | 64 | 2.40% | 109 | 3.91% | 64 | 2.17% |
| Preston | 121 | 3.60% | 105 | 2.90% | 130 | 3.50% | 107 | 2.80% | 99 | 2.47% | 101 | 2.43% |
| Ribble Valley | 26 | 2.00% | 20 | 1.50% | 18 | 1.30% | 24 | 1.80% | 21 | 1.49% | 23 | 1.53% |
| Rossendale | 53 | 3.30% | 45 | 2.70% | 44 | 2.50% | 57 | 3.20% | 39 | 2.08% | 43 | 2.29% |
| South Ribble | 49 | 2.00% | 33 | 1.30% | 54 | 2.10% | 69 | 2.60% | 52 | 1.92% | 42 | 1.53% |
| West Lancashire | 81 | 3.20% | 72 | 2.80% | 55 | 2.10% | 61 | 2.30% | 59 | 2.13% | 68 | 2.45% |
| Wyre | 72 | 3.20% | 88 | 3.90% | 64 | 2.80% | 70 | 3.00% | 71 | 2.84% | 66 | 2.61% |
| Lancashire-12 | 856 | 3.20% | 754 | 2.70% | 775 | 2.70% | 786 | 2.70% | 774 | 2.54% | 732 | 2.35% |
| Blackburn with Darwen | 51 | 1.20% | 35 | 0.80% | 39 | 0.90% | 37 | 0.80% | 21 | 0.40% | 19 | 0.40% |
| Blackpool | 146 | 4.50% | 65 | 2.00% | 112 | 4.00% | 41 | 1.30% | 41 | 1.30% | 80 | 2.40% |
| North West | 3,000 | 1.90% | 2,980 | 1.80% | 3,060 | 1.80% | 2,530 | 1.40% | 2,550 | 1.40% | 2,380 | 1.30% |
| England | 31,420 | 2.70% | 26,200 | 2.20% | 30,090 | 2.40% | 28,220 | 2.20% | 29,000 | 2.20% | 32,100 | 2.40% |
Figure 3: Young people NEET not known by district in Lancashire-12, 2025/26
Source: Children and Family Wellbeing Service (Young People's Service)
In Q1 2026/27, 94.9% of 16/17-year-olds were in Education, Employment or Training (EET), which is 1.0pp more than 93.9% the previous year. This equates to an increase of 907 young people in EET. The overall cohort of 16/17yr olds is 31,183, which is an increase of 648 compared to June 2025. The Q1 position on NEET is 3.8% (1,176 young people), compared to 4.8% (1,460 young people) last year. The Q1 position in relation to the young people whose EET status is not known is 1.4% (422 young people), compared to 1.3% (396 young people) last year. Compared to Q1 2025/26, the position is looking more positive. Our participation figures show that there is a higher proportion of young people accessing college and training than the previous year.
In Q4 of 2025/26, we shared a range of RONIs (Risk of NEET Indicators) across each of the Yr7-11-year groups with a number of our secondary schools. In Q1 of 2026/27, we received a lot of positive feedback from schools in relation to this data set. We have been able to take on board elements of the feedback so that we can make some informed changes to this work during the rest of the year. This data will be shared with all secondary schools going forward.
During Q1, the interim Young People and Work Report commissioned by Rt Hon Alan Milburn was published. This report clearly sets out the issues facing young people aged 16-24 and the various, inter-related factors contributing to them not being in education, employment and training. This report is directly linked to the work of the team, and we await the publication of the second phase of the report later in the year. Linked to this report, a number of authorities have been asked by the DfE to create a NEET Taskforce and we have opted into this. An initial meeting was held during Q1, and work will continue during the coming months to formulate our action plan.
Other actions undertaken in Q1 include making arrangements for a number of drop-in sessions for young people on GCSE results day. These sessions are aimed at supporting young people with advice and guidance on their next steps, once they know their GCSE results. We had our summer term post 16 meeting with our FE and Skills Ofsted lead, and this was a positive meeting covering all the work currently taking place. We held a Belonging and Participation conference for our colleges during Q1, and this covered a range of topics such as attendance and behaviour. This helped our colleges gain a better understanding of the issues facing schools and their pupils and how colleges can better support young people to transition into key stage 5. Finally, the pan-Lancashire Colleges working group on NEET took place in Q1, which we participate in. This is a positive meeting and has led to some of our colleges considering how they can create a different provision offer for young people who are NEET. These meetings will continue throughout the next academic year.
Description of the geographies used in this report
The Lancashire-12 area is comprised of the 12 local authorities that fall within the Lancashire County Council (LCC) administrative boundary. The Lancashire-14 area incorporates the two additional unitary authorities of Blackburn with Darwen and Blackpool and has the same geographic footprint as the Lancashire Local Enterprise Partnership (LEP) area.
The 12 local authorities within the LCC boundary are Burnley Borough Council, Chorley Borough Council, Fylde Borough Council, Hyndburn Borough Council, Lancaster City Council, Pendle Borough Council, Preston City Council, Ribble Valley Borough Council, Rossendale Borough Council, South Ribble Borough Council, West Lancashire Borough Council and Wyre Borough Council.
Page updated 21 August 2026