Key stage 2
Pupils sit formal tests in reading, writing and maths at the end of key stage two (KS2) (aged 11 years). These results are a key performance indicator for primary schools.
The figures are for 2023/24.
Key figures
The proportion of pupils achieving the expected standard in Lancashire-12 (60%) was equal to the North West but slightly lower than in England (61%).
The Lancashire-12 performance has improved from the 2022/23 performance, which was 59%.
Ribble Valley (70%), Chorley (67%) and Wyre (65%) had the largest greatest proportions of pupils achieving the expected standard. Attainment was lowest in Hyndburn (50%) and Burnley (52%).
A smaller proportion of pupils achieved the expected standard in Blackpool (53%) compared to Blackburn with Darwen (62%).
The proportion of free school meal (FSM) pupils reaching the expected standard in Lancashire-12 (42%) was lower that of non-FSM pupils (66%).
Girls (63%) were generally performing better than boys (56%) in reading, writing and maths at KS2 in the Lancashire-12 area (England = 65% for girls and 58% for boys).
The proportion of pupils with no special educational needs (SEN) who achieved the expected standard (69%) was considerably higher than SEN pupils with an education, health and care plan (EHCP) (7%) and SEN pupils without an EHCP (22%) in Lancashire-12.
Overall attainment
Statistics published by the Department for Education indicates that within Lancashire-12, 60% of KS2 pupils reached the expected standard in reading, writing and mathematics. The Lancashire-12 (60%) proportion was slightly lower than the England (61%) performance, however was similar to the North West (60%) performance, and was lower than the Blackburn with Darwen (62%) performance, however was higher than the Blackpool (53%) performance.
Lancashire-12 consistently improved at the end of KS2 until around 2017/18. After a short period of decline the Covid-19 pandemic disrupted the measurement of performance for two years and when testing resumed in 2021/22 the proportion was at its lowest for 6 years. In the subsequent two years there has been a more steady improvement.
Figure 1: Achieving the expected standard in reading, writing and mathematics at KS2, time series
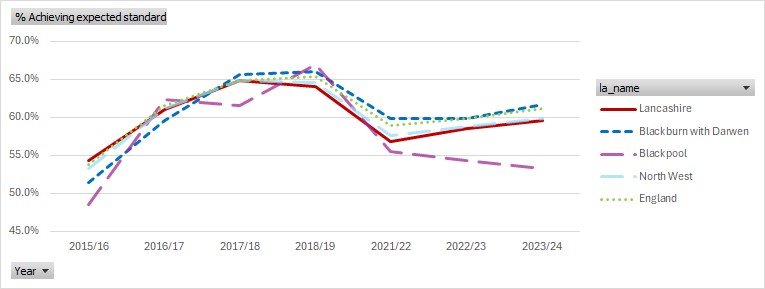
In this chart years 2019/20 and 2020/21 have been removed as no testing was done during the Covid-19 pandemic.
Source: Department for Education (DfE)
While the proportions reaching the expected standard in reading, writing and mathematics are largely similar to the England average, there are some areas within Lancashire-12 where pupils' performance is lower.
The proportion reaching expected standard in reading, writing and mathematics in Fylde (64%), Wyre (65%), Chorley (67%) and Ribble Valley (70%) was higher than Lancashire-12 and above the regional and national comparators. In contrast, attainment was lower in Hyndburn (50%), Burnley (52%) and Rossendale (56%). Performance was also lower in Blackpool (53%).
Table 1: KS2 headline indicator in reading, writing and mathematics, 2023/24
| Area | Eligible pupils | � No. of pupils reaching the expected standard in reading, writing and mathematics | % reaching the expected standard in reading, writing and mathematics |
|---|---|---|---|
| Burnley | 1,243 | 650 | 52 |
| Chorley | 1,424 | 947 | 67 |
| Fylde | 778 | 498 | 64 |
| Hyndburn | 1,128 | 563 | 50 |
| Lancaster | 1,550 | 923 | 60 |
| Pendle | 1,348 | 807 | 60 |
| Preston | 1,941 | 1,118 | 58 |
| Ribble Valley | 657 | 460 | 70 |
| Rossendale | 874 | 490 | 56 |
| South Ribble | 1,279 | 778 | 61 |
| West Lancashire | 1,271 | 793 | 62 |
| Wyre | 1,171 | 764 | 65 |
| Lancashire-12 | 14,638 | 8,729 | 60 |
| Blackburn with Darwen | 2,285 | 1,409 | 62 |
| Blackpool | 1,711 | 912 | 53 |
| Lancashire-14 | 18,634 | 11,050 | 59 |
| North West | 91,105 | 54,508 | 60 |
| England | 656,637 | 401,382 | 61 |
District figures (Burnley to Wyre) are based on place of pupil residence
Source: Department for Education (DfE)
Attainment and free school meals
Eligibility for FSM indicates that a pupil is from a low-income background. The provision of free school meals has traditionally been a reliable indicator of the extent and degree of child poverty in the United Kingdom.
During 2023/24, the proportion of FSM pupils reaching the expected standard in reading, writing and mathematics at the end of KS2 in Lancashire-12 (42%) was lower than that of non-FSM pupils (66%). The Lancashire-12 FSM pupil's proportion was lower than Blackburn with Darwen (49%), England (46%), North West (45%), and Blackpool (43%).
The Lancashire-12 non-FSM pupil performance (66%) was higher than that of Blackpool and was slightly lower than that of the other comparator areas.
The percentage gap between FSM and non-FSM was wider for Lancashire-12 (+24 percentage points) than all the other comparator areas other than its own constituent districts.
Table 2: Proportion reaching expected standard in reading, writing and mathematics at KS2 by FSM eligibility, 2023/24
| Area | FSM (%) | Non FSM (%) | Percentage difference (PP) |
|---|---|---|---|
| Burnley | 31 | 69 | 38 |
| Chorley | 45 | 72 | 27 |
| Fylde | 42 | 71 | 29 |
| Hyndburn | 42 | 54 | 12 |
| Lancaster | 40 | 67 | 27 |
| Pendle | 47 | 66 | 19 |
| Preston | 39 | 66 | 27 |
| Ribble Valley | 47 | 74 | 27 |
| Rossendale | 38 | 63 | 25 |
| South Ribble | 38 | 67 | 29 |
| West Lancashire | 46 | 68 | 22 |
| Wyre | 51 | 70 | 19 |
| Lancashire-12 | 42 | 66 | 24 |
| Blackburn with Darwen | 49 | 67 | 18 |
| Blackpool | 43 | 62 | 19 |
| Lancashire-14 | 45 | 65 | 20 |
| North West | 45 | 67 | 22 |
| England | 46 | 67 | 21 |
District figures (Burnley to Wyre) are based on place of pupil residence
Source: Department for Education (DfE)
Attainment and gender
There are also significant differences in attainment according to gender. Table 3 shows that Lancashire-12 follows a regional and national pattern with girls generally performing better than boys in reading, writing and maths at KS2.
Table 3: Proportion reaching expected standard in reading, writing and mathematics at KS2 by gender, 2023/24
| Area | Boys (%) | Girls (%) |
|---|---|---|
| Lancashire-12 | 56 | 63 |
| Blackburn with Darwen | 59 | 65 |
| Blackpool | 50 | 57 |
| Lancashire-14 | 56 | 63 |
| North West | 56 | 63 |
| England | 58 | 65 |
Source: Department for Education (DfE)
Attainment and special educational needs
Education is a key to a more fulfilling future for children, but for those with SEN too many barriers can stand in the way of the right education and support. In DfE figures, attainment figures includes pupils with SEN who either have an EHCP or receive SEN support but do not have an EHCP.
In Lancashire-12, the proportion of SEN pupils with an EHCP who reached the expected standard in reading, writing and mathematics at KS2 (7%) was considerably lower than non-SEND pupils (69%). These proportions were slightly lower than England, for both SEN pupils with an EHCP (9%) and non-SEN pupils (72%).
The proportion of SEN pupils who receive SEN support but do not have an EHCP who reach the expected standard (22%) was also lower than non-SEN pupils in Lancashire-12. This proportion was lower than in England (26%)
Table 4: Proportion reaching the expected standard in reading, writing and mathematics at KS2 by SEND status, 2023/24
| Area | Pupils with no identified SEN (%) | SEN with a statement or EHCP (%) | SEN receiving support, without EHCP (%) |
|---|---|---|---|
| Lancashire-12 | 69 | 7 | 22 |
| Blackburn with Darwen | 73 | 7 | 25 |
| Blackpool | 63 | 10 | 18 |
| Lancashire-14 | 69 | 8 | 22 |
| North West | 71 | 9 | 26 |
| England | 72 | 9 | 26 |
Source: Department for Education (DfE)
Children and young people dashboard
The children and young people dashboard created as part of the Neighbourhood JSNA, now includes district and ward level data for KS2 / KS4 / Pupil Absence / Exclusions / NEET. This resource can be accessed here.
The Department for Education website provides statistics on KS2 results for recent years.
Page updated June 2025