
Attendance and exclusions
Attendance summary
Attendance at school is linked directly with better performance in examinations and an increased likelihood of securing employment. Some of those pupils who are absent from school have an increased likelihood of becoming involved in youth offending. They are also more likely to be involved in risk taking behaviours, such as alcohol and drug use.
Key points for School Attendance, 2024/25
During 2024/25, overall levels of absence in Lancashire-12 schools (6.62%) were lower than the national (6.78%), regional (6.82%), and neighbouring unitary authorities' rates (Blackburn with Darwen 6.76% and Blackpool 7.46%).
The level of persistent absenteeism in Lancashire-12 schools (17.59%), under the definition which includes pupils having an overall absence rate of 10 per cent or above, was also lower than the national (18.14%), regional (18.27%) and neighbouring unitary authorities' rates (Blackburn with Darwen 19.07% and Blackpool 22.02%).
The overall absence rate for Lancashire-12 has reduced compared to the previous year (6.62%, compared to 7.06% in 2023/24) and remains below comparator rates. The county is in the second quartile nationally and ranked 62 of 153 authorities.
Please click here to view the Department for Education's pupil absence for recent years.
The county is in the second quartile nationally and ranked 49 out of 152 authorities.
Primary and secondary attendance
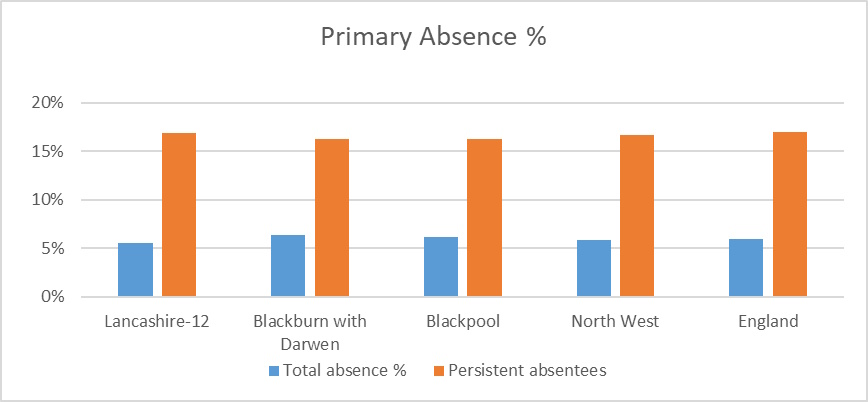
During 2024/25, the proportion of overall absence levels in primary schools within Lancashire-12 (5.1%) (Table 1 and Figure 1) was lower than the regional (5.1%), national (5.2%), Blackburn with Darwen (5.3%), and Blackpool (5.7%) averages. The level of persistent absenteeism for Lancashire-12 (12.35%) (Defined as pupils having an overall absence rate of around 10 percent of authorised and/or unauthorised absence) was lower than the regional (12.94), national (12.99%) and neighbouring unitary authority rates (13.98% in Blackburn with Darwen and 15.45% in Blackpool). Lancashire-12 is currently in Quartile Banding B and ranks as the 65th local authority in the Latest National Rank, with the worst performing local authority being Knowsley which is currently in Quartile Banding D and ranks as the 152nd local authority.
Table 1: Absence levels in state funded primary schools, 2024/25 (six half terms)
| Absence Type | Total absence % | Persistent absentees % |
|---|---|---|
| Lancashire-12 | 5.1 | 12.35 |
| Blackburn with Darwen | 5.3 | 13.98 |
| Blackpool | 5.7 | 15.45 |
| North West | 5.1 | 12.94 |
| England | 5.2 | 12.99 |
Figure 1: Absence levels in state funded primary schools, 2024/25 (six half terms)
Source: Department for Education (DfE)/Lancashire County Council (LCC) Business Intelligence.
* Only 151 authorities are counted here because the Isles of Scilly have just one (all age) school which is classed in the data table as a secondary school.
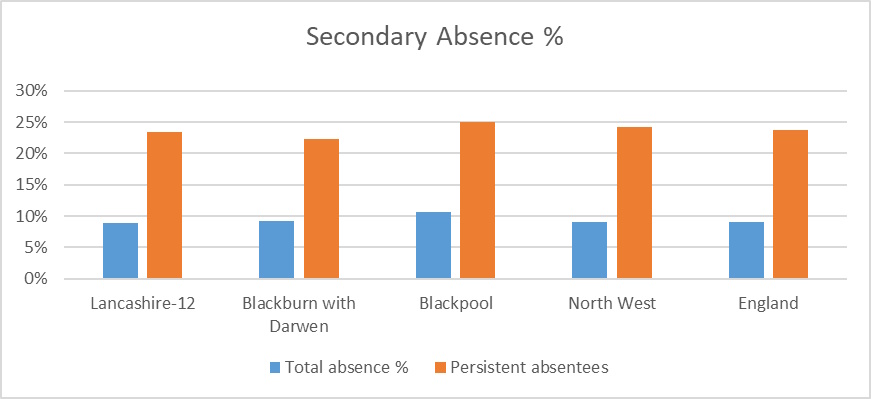
During 2024/25, the overall absence levels in secondary schools within Lancashire-12 (9.0%) (Table 2 and Figure 2) was higher than the national and Blackburn with Darwen (8.9%) rates and lower than the regional (9.1%) and Blackpool (10.6%) rates. Lancashire-12 is currently in Quartile Banding C and ranks as the 83rd local authority in the Latest National Rank, with the worst performing local authority being Knowsley which is currently in Quartile Banding D and ranks as the 152nd local authority. The level of persistent absenteeism in Lancashire-12 (26.3%) was also lower than the national (25.6%) and regional (26.1%) rates, however was higher than the Blackburn with Darwen (27.3%) and Blackpool (33.1%) rates.
Table 2: Absence levels in state funded secondary schools, 2024/25 (six half terms)
| Absence Type | Total absence % | Persistent absentees % |
|---|---|---|
| Lancashire-12 | 8.4 | 23.3 |
| Blackburn with Darwen | 8.4 | 24.5 |
| Blackpool | 9.6 | 29.6 |
| North West | 8.6 | 23.8 |
| England | 8.4 | 23.4 |
Figure 2: Absence levels in state funded secondary schools, 2024/25 (six half terms)
Source: DfE/LCC Business Intelligence. * Only 151 authorities are counted here because the City of London has just one school which is a primary school.
Attendance in districts
At district level (table 3) reflecting the link between school attendance and deprivation, overall absence was high in Burnley (8.4%), West Lancashire (7.4%), Pendle (7.9%) and Hyndburn (7.3%) where levels of relative deprivation are highest. However, Lancaster (7.6%) district which is not considered to be highly deprived had a high level of overall and persistent absence based on school location.
Table 3: Absence levels in state funded schools by Lancashire-12 district, 2024/25 (six half terms)
| District | Total absence % | Persistent absence % |
|---|---|---|
| Burnley | 8.4 | 22 |
| Chorley | 6.2 | 20.4 |
| Fylde | 7.1 | 22.2 |
| Hyndburn | 7.3 | 18.9 |
| Lancaster | 7.6 | 22.2 |
| Pendle | 7.9 | 19.9 |
| Preston | 6.6 | 20.2 |
| Ribble Valley | 6.1 | 20.2 |
| Rossendale | 6.5 | 20.2 |
| South Ribble | 6.7 | 22.8 |
| West Lancashire | 7.4 | 20.6 |
| Wyre | 7.2 | 22.3 |
Source: DfE/LCC Business Intelligence
District and ward level data on pupil absence can be found in the children and young people dashboard created as part of the Neighbourhood JSNA.
Addressing absence and their causes is an ongoing focus for the Authority.
Causes: Absence continues to be an issue post Covid with mental health being the highest cause of absence after sickness.
Actions: The Attendance Strategy was consulted on in Autumn 2024. The case work service for attendance was launched in April 2025. Attendance team continue to visit all schools to offer challenge and support. Several attendance working groups of schools sharing best practice around attendance continue to develop.
Exclusions summary
Research has suggested that there is a direct link between being excluded from school and getting involved in crime. A Youth Justice Board survey showed that, when compared with other school children, excluded pupils were more than twice as likely to get involved in crime. Consequently, it is argued that reducing the number of exclusions can have a knock-on effect on reducing crime.
Key points for School Exclusions, 2022/23
During 2024/25, there were 458 permanent exclusions and 18,480 fixed period exclusions in Lancashire schools. The Lancashire-12 rate slightly increased compared to the previous year for permanent exclusions (0.26%, against 0.24%) and was still higher than the national (0.12%), the regional (0.17%) and Blackburn with Darwen (0.17%), however was also lower than Blackpool (0.45%) rates.
Data for 2024/25 (Table 1) indicates that the proportion of permanent exclusions in Lancashire-12 primary schools (0.07%) increased compared to the previous year (0.06%). This is higher than the national (0.03%) and regional (0.04%) rates, and higher than Blackburn with Darwen (0.05%), however is lower than Blackpool (0.08%). The number of permanent primary exclusions was 69.
Compared to primary schools, the proportion of permanently excluded pupils is higher in Lancashire secondary schools. Data for 2024/25 (Table 3) indicates that the percentage of permanent exclusions was 0.53%, a 0.03% percentage point increase from the previous year. There were 382 permanent secondary school exclusions in 2024/25. Since 2012/13, the proportion of permanent exclusions in Lancashire secondary schools have been significantly higher than the national and regional figures.
The 2019/20 data should be treated with caution as it was interrupted by with the first national lockdown on 23 March 2020, during the spring term. Schools remained open for vulnerable children and children of key workers.
Addressing exclusions and their causes is an ongoing focus for the Authority.
Please click here to view the Department for Education's Exclusions data for recent years.
Below is a further insight into the data.
Primary exclusions
Data for 2024/25 (Table 1) indicates that the proportion of permanent exclusions in Lancashire-12 primary schools (0.07%) increased compared to the previous year (0.06%). This is higher than the national (0.03%) and regional (0.04%) rates, and higher than Blackburn with Darwen (0.05%), however is lower than Blackpool (0.08%). The number of permanent primary exclusions was 69.
Table 1: Proportion of pupils permanently excluded in state funded primary schools, 2012/13 to 2024/25
| Area | 2012-13 | 2013-14 | 2014-15 | 2015-16 | 2016-17 | 2017-18 | 2018-19 | 2019-20 | 2021-22 | 2022-23 | 2023-24 | 2024-25 |
|---|---|---|---|---|---|---|---|---|---|---|---|---|
| Lancashire-12 | 0.04% | 0.06% | 0.05% | 0.08% | 0.06% | 0.04% | 0.03% | 0.02% | 0.03% | 0.05% | 0.06% | 0.07% |
| Blackburn with Darwen | 0.01% | 0.01% | 0.01% | 0.00% | 0.01% | 0.02% | 0.04% | 0.01% | 0.00% | 0.03% | 0.03% | 0.05% |
| Blackpool | 0.00% | 0.01% | 0.00% | 0.01% | 0.02% | 0.00% | 0.00% | 0.00% | 0.00% | 0.01% | 0.03% | 0.08% |
| North West | 0.01% | 0.02% | 0.02% | 0.03% | 0.03% | 0.03% | 0.02% | 0.02% | 0.02% | 0.03% | 0.04% | 0.04% |
| England | 0.02% | 0.02% | 0.02% | 0.02% | 0.03% | 0.03% | 0.02% | 0.02% | 0.02% | 0.03% | 0.03% | 0.03% |
Source: Department for Education (DfE) - The figures for 2020/21 have been omitted, as this academic year was affected by the COVID-19 pandemic.
The proportion of fixed-term exclusions within Lancashire-12 primary schools increased during 2022/23 (Table 2). The Lancashire-12 rate (1.82%) was higher than the Blackburn with Darwen (1.32%) rate, regionally (1.41%) and nationally (1.81%), however was lower than the Blackpool rate (2.92%). Historical data indicates that Lancashire-12 performance is generally better than the averages regionally, nationally and for the neighbouring unitary authorities of Blackburn with Darwen and Blackpool. However, between 2012/13 and 2022/23, and since 2017/18, Blackburn with Darwen has had lower rates (on average: 0.95%) than Lancashire-12.
Table 2: Proportion of pupils subject to fixed-term exclusions in state funded primary schools, 2012/13 to 2022/23
| Area | 2012-13 | 2013-14 | 2014-15 | 2015-16 | 2016-17 | 2017-18 | 2018-19 | 2019-20 | 2021-22 | 2022-23 | 2023-24 | 2024-25 |
|---|---|---|---|---|---|---|---|---|---|---|---|---|
| Lancashire-12 | 0.73% | 0.89% | 0.83% | 1.02% | 1.16% | 1.25% | 1.06% | 0.71% | 1.32% | 1.82% | 2.07% | 2.62% |
| Blackburn with Darwen | 0.65% | 0.68% | 0.88% | 1.09% | 1.19% | 1.07% | 1.02% | 0.62% | 0.95% | 1.32% | 1.72% | 2.20% |
| Blackpool | 1.43% | 1.63% | 1.19% | 1.45% | 1.70% | 2.08% | 2.48% | 1.67% | 1.81% | 2.92% | 4.88% | 4.87% |
| North West | 0.76% | 0.86% | 0.91% | 1.01% | 1.18% | 1.16% | 1.12% | 0.76% | 1.10% | 1.41% | 1.76% | 2.01% |
| England | 0.88% | 1.02% | 1.10% | 1.21% | 1.37% | 1.40% | 1.41% | 1.00% | 1.42% | 1.81% | 2.27% | 2.47% |
Source: DfE - The figures for 2020/21 have been omitted, as this academic year was affected by the COVID-19 pandemic.
Secondary Exclusions
Compared to primary schools, the proportion of permanently excluded pupils is higher in Lancashire secondary schools. Data for 2024/25 (Table 3) indicates that the percentage of permanent exclusions was 0.53%, a 0.03% percentage point increase from the previous year. There were 382 permanent secondary school exclusions in 2024/25. Since 2012/13, the proportion of permanent exclusions in Lancashire secondary schools have been significantly higher than the national and regional figures.
Table 3: Proportion of pupils permanently excluded in state funded secondary schools, 2012/13 to 2024/25
| Area | 2012-13 | 2013-14 | 2014-15 | 2015-16 | 2016-17 | 2017-18 | 2018-19 | 2019-20 | 2021-22 | 2022-23 | 2023-24 | 2024-25 |
|---|---|---|---|---|---|---|---|---|---|---|---|---|
| Lancashire-12 | 0.18% | 0.22% | 0.29% | 0.34% | 0.45% | 0.42% | 0.44% | 0.20% | 0.30% | 0.54% | 0.50% | 0.53% |
| Blackburn with Darwen | 0.12% | 0.01% | 0.01% | 0.03% | 0.03% | 0.06% | 0.09% | 0.18% | 0.15% | 0.25% | 0.30% | 0.33% |
| Blackpool | 0.03% | 0.14% | 0.74% | 0.33% | 0.59% | 0.64% | 0.82% | 0.20% | 0.34% | 0.54% | 0.70% | 1.02% |
| North West | 0.14% | 0.15% | 0.19% | 0.24% | 0.31% | 0.29% | 0.30% | 0.19% | 0.25% | 0.34% | 0.39% | 0.36% |
| England | 0.12% | 0.13% | 0.15% | 0.17% | 0.20% | 0.20% | 0.20% | 0.13% | 0.16% | 0.22% | 0.25% | 0.23% |
Source: DfE - The figures for 2020/21 have been omitted, as this academic year was affected by the COVID-19 pandemic.
The proportion of fixed term exclusions in secondary schools is much higher than in primary schools. The rate in Lancashire-12 increased in 2024/25 to 21.64% (Table 4). This was lower than the Blackpool (33.19%), regional (23.09%) and Blackburn with Darwen (23.01%) rates but was still higher than the national (21.24%) rate.
Table 4: Proportion of pupils subject to fixed-term exclusions in state funded secondary schools, 2012/13 to 2024/25
| Area | 2012-13 | 2013-14 | 2014-15 | 2015-16 | 2016-17 | 2017-18 | 2018-19 | 2019-20 | 2021-22 | 2022-23 | 2023-24 | 2024-25 |
|---|---|---|---|---|---|---|---|---|---|---|---|---|
| Lancashire-12 | 6.07% | 6.42% | 6.67% | 8.15% | 8.93% | 8.59% | 10.47% | 6.41% | 15.07% | 19.80% | 21.15% | 21.64% |
| Blackburn with Darwen | 3.41% | 1.80% | 2.12% | 2.67% | 3.66% | 4.57% | 4.74% | 4.12% | 10.71% | 13.46% | 19.70% | 23.01% |
| Blackpool | 11.34% | 11.79% | 21.61% | 15.24% | 19.17% | 19.41% | 29.63% | 15.65% | 23.81% | 43.18% | 28.40% | 33.19% |
| North West | 7.07% | 7.05% | 8.10% | 8.67% | 9.42% | 9.81% | 11.33% | 7.57% | 15.50% | 20.08% | 23.87% | 23.09% |
| England | 6.72% | 6.62% | 7.51% | 8.46% | 9.40% | 10.13% | 10.75% | 7.43% | 13.96% | 18.90% | 22.61% | 21.24% |
Source: DfE - The figures for 2020/21 have been omitted, as this academic year was affected by the COVID-19 pandemic.
Total Exclusions
Recent data published by the Department for Education confirms there were 458 permanent exclusions during the 2024/25 period in Lancashire schools. Table 5 shows that this equates to a rate of 0.26% and is an increase on the 2023/24 rate (by 0.02 percentage points) and was above the national (0.12%) and regional rates (0.17%). It was also above Blackburn with Darwen (0.17%), however was below the neighbouring authority of Blackpool (0.45%). Lancashire-12 were positioned in quartile D nationally and were ranked 145 of 153 LAs.
Table 5: Proportion of pupils subject to total permanent exclusions in all state funded primary and secondary schools, 2012/13 to 2024/25
| Area | 2012-13 | 2013-14 | 2014-15 | 2015-16 | 2016-17 | 2017-18 | 2018-19 | 2019-20 | 2021-22 | 2022-23 | 2023-24 | 2024-25 |
|---|---|---|---|---|---|---|---|---|---|---|---|---|
| Lancashire-12 | 0.10% | 0.12% | 0.15% | 0.18% | 0.21% | 0.18% | 0.19% | 0.09% | 0.14% | 0.25% | 0.24% | 0.26% |
| Blackburn with Darwen | 0.05% | 0.01% | 0.01% | 0.01% | 0.02% | 0.03% | 0.06% | 0.08% | 0.07% | 0.13% | 0.15% | 0.17% |
| Blackpool | 0.01% | 0.06% | 0.27% | 0.12% | 0.22% | 0.22% | 0.29% | 0.07% | 0.13% | 0.22% | 0.29% | 0.45% |
| North West | 0.07% | 0.07% | 0.09% | 0.11% | 0.14% | 0.13% | 0.12% | 0.08% | 0.11% | 0.16% | 0.18% | 0.17% |
| England | 0.06% | 0.06% | 0.07% | 0.08% | 0.10% | 0.10% | 0.09% | 0.06% | 0.08% | 0.11% | 0.13% | 0.12% |
Source: DfE - The figures for 2020/21 have been omitted, as this academic year was affected by the COVID-19 pandemic.
The proportion of fixed term exclusions in all state funded schools is higher in 2024/25 compared to previous years. The rate in Lancashire-12 increased in 2024/25 to 10.55% (Table 6). This was lower than the Blackpool (17.46%), Blackburn with Darwen (11.26%), regional (10.96%) and national (10.88%) rates. Lancashire-12 were positioned in quartile C nationally and were ranked 78 of 153 LAs.
Table 6: Proportion of pupils subject to fixed term exclusions in all state funded primary and secondary schools, 2013/14 to 2024/25
| Area | 2013-14 | 2014-15 | 2015-16 | 2016-17 | 2017-18 | 2018-19 | 2019-20 | 2021-22 | 2022-23 | 2022-24 | 2022-25 |
|---|---|---|---|---|---|---|---|---|---|---|---|
| Lancashire-12 | 3.42% | 3.36% | 4.05% | 4.42% | 4.36% | 5.06% | 3.13% | 7.12% | 9.37% | 10.00% | 10.55% |
| Blackburn with Darwen | 1.12% | 1.38% | 1.76% | 2.34% | 2.90% | 2.83% | 2.25% | 5.49% | 6.80% | 9.69% | 11.26% |
| Blackpool | 5.43% | 8.61% | 6.42% | 7.99% | 8.15% | 12.06% | 6.72% | 10.34% | 18.90% | 14.25% | 17.46% |
| North West | 3.51% | 3.90% | 4.15% | 4.81% | 4.69% | 5.30% | 3.58% | 7.12% | 9.23% | 11.07% | 10.96% |
| England | 3.50% | 3.88% | 4.29% | 4.76% | 5.08% | 5.36% | 3.76% | 6.91% | 9.34% | 11.31% | 10.88% |
Source: DfE - The figures for 2020/21 have been omitted, as this academic year was affected by the COVID-19 pandemic.
The 2019/20 data should be treated with caution as it was interrupted by with the first national lockdown on 23 March 2020, during the spring term. Schools remained open for vulnerable children and children of key workers. While permanent exclusions and suspensions were still possible throughout the academic year, school closures have had a substantial effect on the number of permanent exclusions and suspension and therefore caution should be taken when comparing figures across years.
Addressing exclusions and their causes is an ongoing focus for the Authority.
Causes: There has been a rise in complex behaviours as schools due to rise in mental health needs, increase in complexity of special needs – some of this is caused by non-socialisation during Covid but some is due to not being assessed during Covid, and reduction in support staff due to lower school budgets and difficulty in recruiting quality teaching assistants.
Actions: Services continues to provide free specialist early intervention work where possible, behaviour consultant training, behaviour quality audits, increase in special school places, however this is difficult as capacity of staff is stretched in local authority SEND service, NHS and schools. Lancashire Skills Hub is going to run Skills Bootcamps for teaching assistants, LPDS have put in a bid for us to run these and this will help to train and engage more support staff.
Page updated August 2026