Lancashire-12 and 14 areas
Official yearly unemployment statistics for January 2017 to December 2017
Unemployment overview
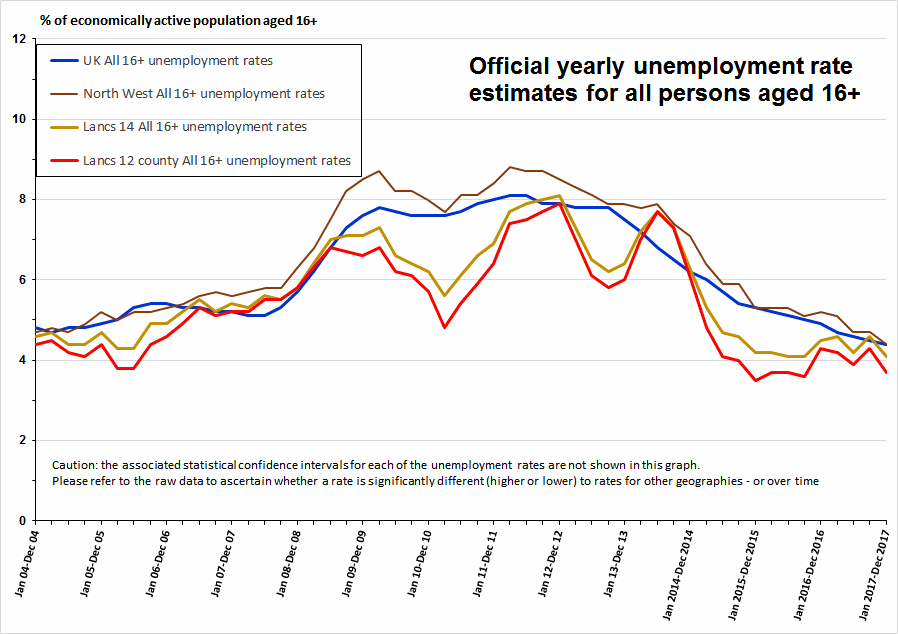
Unemployment has fallen substantially since the peaks following the 2008/09 recession and the 16+ yearly unemployment rates are back to pre-recession levels, or lower. The UK yearly unemployment rate (4.4% (+/- 0.1%) is the lowest in this series (since the year ending December 2004).
Unemployment has continued to fall in the UK and North West over the previous year.
Estimates for both the Lancashire-12 and Lancashire-14 areas also suggest decreases in unemployment over the year (although these changes are not significantly different in statistical terms).
The Lancashire-14 unemployment rate (4.1% (+/- 0.7%) is the joint lowest in the series (since the year ending December 2004).
For the Lancashire-12 area, the unemployment rate (3.7% (+/- 1.0%)) is the joint third lowest in the series.
Estimates for both the Lancashire-12 and Lancashire-14 areas have fluctuated over the last couple of years at the lower end of their respective unemployment ranges.
The Lancashire-14 area has seen a slight increase in numbers since the low point estimated for the year ending September 2016, and the Lancashire-12 area has seen a slight increase since the low point estimated for the year ending December 2015 (these changes are not significantly different in statistical terms).
These yearly unemployment figures are sourced from the Office for National Statistics (ONS) Annual Population Survey (APS), via the National On-line Manpower Information System (Nomisweb). They are published quarterly. Please note that the yearly statistics are different to the three monthly headline unemployment figures for the UK and regions that are reported each month in the media. The yearly statistics also lag the headline figures by two to five months.
Figure U1: Official unemployment rate estimates from the year ending December 2004 to the year ending December 2017

Source: Office for National Statistics, Annual Population Survey, via the National On-line Manpower Information System (Nomisweb).
Unemployment for the year January 2017 to December 2017
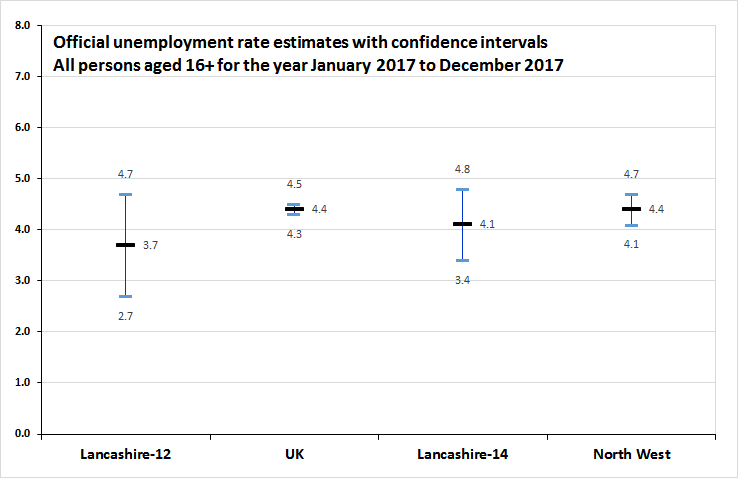
Official estimates of unemployment in the UK, for the year from January 2017 to December 2017, totalled 1,463,500 persons with an estimated unemployment rate of 4.4% (+/- 0.1%). This yearly rate is the lowest in this series (since the year ending December 2004).
For the year ending December 2017, the estimated Lancashire-12 unemployment total was 22,100 persons, and the Lancashire-14 estimated unemployment total was 30,400 people.
Owing to the overlapping confidence intervals (the potential statistical variance), the two rates for the Lancashire-12 area (3.7% (+/- 1.0%)), and the Lancashire-14 area (4.1% (+/- 0.7%)), cannot be said to be lower or higher than the yearly UK unemployment rate (4.4% (+/- 0.1%)) in statistical terms.
The Lancashire-14 unemployment rate (4.1% (+/- 0.7%) is the joint lowest in the series (since the year ending December 2004). The latest rate is the same as the estimates for the years ending June 2016 and September 2016. The latest estimated number of unemployed people for the Lancashire-14 area (30,400) is however higher than the 29,400 estimated for the year ending September 2016.
For the Lancashire-12 area, the unemployment rate (3.7% (+/- 1.0%)) is the joint third lowest in the series (since the year ending December 2004).
The North West yearly unemployment estimate stood at 157,200 persons with an unemployment rate of 4.4% (+/- 0.3%)). This was similar to the UK rate.
Figure U2: Official unemployment rates with confidence intervals for the year January 2017 to December 2017

Source: Office for National Statistics, Annual Population Survey via the National On-line Manpower Information System (Nomisweb).
Yearly and recent changes in unemployment
United Kingdom - yearly and recent changes
Unemployment at the UK level has fallen by an estimated -142,600 persons (-8.9%) over the year, falling from 1,606,000 to 1,463,500 people. The UK rate fell by -0.5 percentage points, from 4.9% (+/- 0.1%), to 4.4% (+/- 0.1%) over the year. This is a statistically significant decrease.
Following the 2008/09 recession, UK unemployment peaked at an estimated 2,576,700 persons with a rate of 8.1% (+/- 1.0%) for the year ending June 2012. Since this time, UK unemployment is now estimated to be lower by 1,113,200 people (43.2%) and the rate has fallen by an estimated 3.7 percentage points.
Lancashire-12 area - yearly and recent changes
Estimates for the Lancashire-12 area indicate that the unemployment total has also fallen by 3,400 persons (13.3%) over the year, decreasing from 25,500 people to 22,100 people. The Lancashire-12 unemployment rate has reduced by an estimated 0.6 percentage points, from 4.3% (+/- 1.1%), for the year ending December 2017, to 3.7% (+/- 1.0%), for the year ending December 2017. Owing to the wide and overlapping statistical confidence intervals this change is not significantly different.
Since the year ending December 2004, unemployment in the Lancashire-12 area is estimated to have reached a low point for the year ending December 2015, with 20,300 unemployed persons and a rate of 3.5% (+/- 1.0%). Since this time, unemployment in the Lancashire-12 area has risen by an estimated 1,800 persons (8.9%) and the rate has risen by 0.2 percentage points to 3.7% (+/- 1.0%). Owing to the wide and overlapping statistical confidence intervals this change is not significantly different.
Following the 2008/09 recession, unemployment in the Lancashire-12 area peaked at an estimated 46,000 persons with a rate of 7.9% (+/- 1.4%) for the year ending December 2012. Since this time, unemployment has fallen by and estimated 23,900 persons (52.0%) and the rate has fallen by an estimated 4.2 percentage points to 3.7% (+/- 1.0%). This change is significantly different in statistical terms.
Lancashire-14 area - yearly and recent changes
Estimates for the Lancashire-14 area indicate that unemployment has decreased by 2,400 persons (7.3%) over the year, falling from 32,800 people, to 30,400 people. The Lancashire-14 unemployment rate has reduced by an estimated 0.4 percentage points, from 4.5% (+/- 0.8%), for the year ending December 2016, to 4.1% (+/- 0.7%), for the year ending December 2017. Owing to the wide and overlapping statistical confidence intervals this change is not significantly different.
Since the year ending December 2004, unemployment for the Lancashire-14 area is estimated to have reached a low point for the year ending September 2016, with 29,400 unemployed persons and a rate of 4.1% (+/- 0.7%). Since this time, unemployment in the Lancashire-14 area has risen by an estimated 1,000 persons (3.4%) although the rate is estimated to be the same at 4.1% (+/- 0.7%).
Following the 2008/09 recession, unemployment in the Lancashire-14 area peaked at an estimated 58,200 persons with a rate of 8.1% (+/- 1.0%), also for the year ending December 2012. Unemployment has fallen by and estimated 27,800 persons (47.8%) since this time, and the rate has fallen by an estimated 4.0 percentage points to 4.1% (+/- 0.7%). This change is significantly different in statistical terms.
Table U1: Official unemployment estimates from the Annual Population Survey - persons aged 16+ for the year January 2017 to December 2017 and yearly changes (from the year to December 2016)
|
Notes: [1] Yearly estimates (produced quarterly). [2] The unemployment numbers and associated denominators (economically active populations aged 16+) in the table are rounded to the nearest 100, therefore the rates when calculated from the rounded figures may not match the actual published rates (which are calculated from unrounded figures). [3] Confidence intervals = 95% confidence interval of percentage figure. To obtain the full potential range of the unemployment rate (including the +/- confidence interval) add and subtract the confidence interval figure from the percentage unemployment rate. [4] Change in the unemployment rate: please note that although the number unemployed may not have changed, a change in the unemployment rate may occur owing to a change in the economically active denominator between dates. Source: Annual Population Survey – Office for National Statistics – via the National On-line Manpower Information System (Nomisweb). |
|||||||
| Total unemployment estimates - for year from January 2017 to December 2017 | Change since year to December 2016 | ||||||
| Area | Total number of persons unemployed | All persons aged 16+ economically active | Unemployment rate - all persons 16+ | with confidence intervals (+/-%) given below | Number | % | in rate |
| Lancashire-12 | 22,100 | 602,700 | 3.7 | 1.0 | -3,400 | -13.3 | -0.6 |
| Lancashire-14 | 30,400 | 732,300 | 4.1 | 0.7 | -2,400 | -7.3 | -0.4 |
| North West | 157,200 | 3,539,700 | 4.4 | 0.3 | -23,400 | -13.0 | -0.8 |
| England | 1,242,000 | 28,295,500 | 4.4 | 0.1 | -111,600 | -8.2 | -0.4 |
| Great Britain | 1,424,700 | 35,526,800 | 4.4 | 0.1 | -126,700 | -8.2 | -0.4 |
| United Kingdom | 1,463,500 | 33,400,200 | 4.4 | 0.1 | -142,600 | -8.9 | -0.5 |
Lancashire-12 and Lancashire-14 geographies
The Lancashire-12 area is comprised of the 12 local authorities that fall within the Lancashire County Council administrative boundary. The Lancashire-14 area incorporates the two additional unitary authorities of Blackburn with Darwen and Blackpool and has the same geographic footprint as the Lancashire Local Enterprise Partnership (LEP) area.
The 12 local authorities within the LCC boundary are Burnley Borough Council, Chorley Borough Council, Fylde Borough Council, Hyndburn Borough Council, Lancaster City Council, Pendle Borough Council, Preston City Council, Ribble Valley Borough Council, Rossendale Borough Council, South Ribble Borough Council, West Lancashire Borough Council and Wyre Borough Council.
Source of latest labour market data for local authority areas
The most up to date labour market variables and population figures are available within the labour market profiles for local authorities via the National Online Manpower Information Service (Nomis) web site.
- Burnley • Chorley • Fylde • Hyndburn • Lancaster • Pendle • Preston • Ribble Valley • Rossendale • South Ribble • West Lancashire • Wyre • Blackburn with Darwen • Blackpool
Page updated June 2018