16+ employment estimates
Business Intelligence analyses 16+ employment estimates from the Annual Population Survey in order that unemployment, economic activity and economic inactivity can be analysed and graphed on a consistent basis (for persons aged 16+). Employment of persons aged 65 and over is also becoming more prevalent. Analysis of the 16+ employment estimates also allows a full picture of the self-employed and employee estimates to be ascertained.
Key points
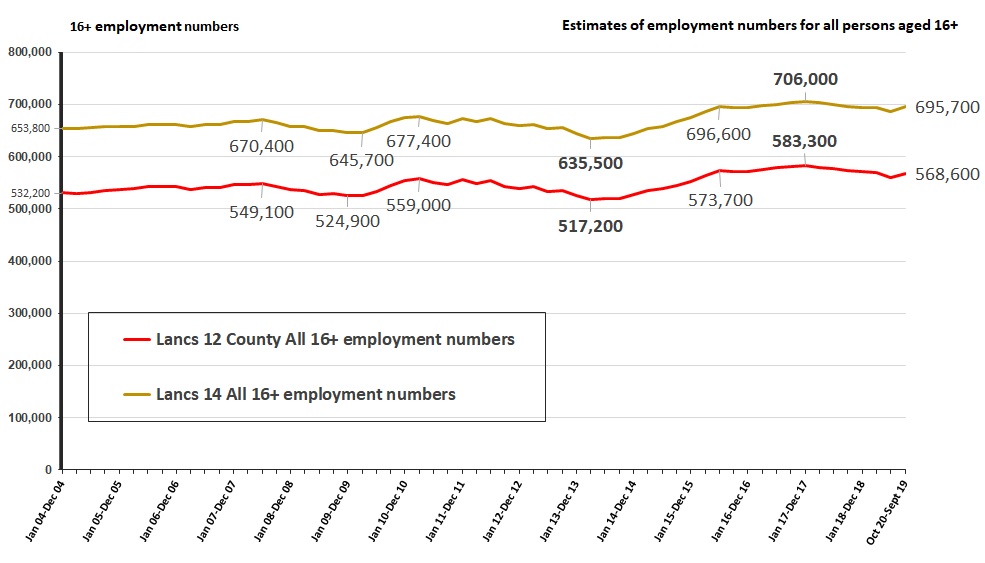
For the year from October 2018 to September 2019, 16+ employment was estimated at 568,600 in the Lancashire-12 area and 695,700 persons in the Lancashire-14 area. These figures are estimated to be lower than the peaks for the year ending December 2017.
Figure E1: Estimates of 16+ employment numbers (without confidence intervals) for the Lancashire-12 and Lancashire-14 areas from the year ending December 2004 to the year from October 2018 to September 2019

Source: Office for National Statistics, Annual Population Survey via the National On-line Manpower Information System (N.O.M.I.S.).
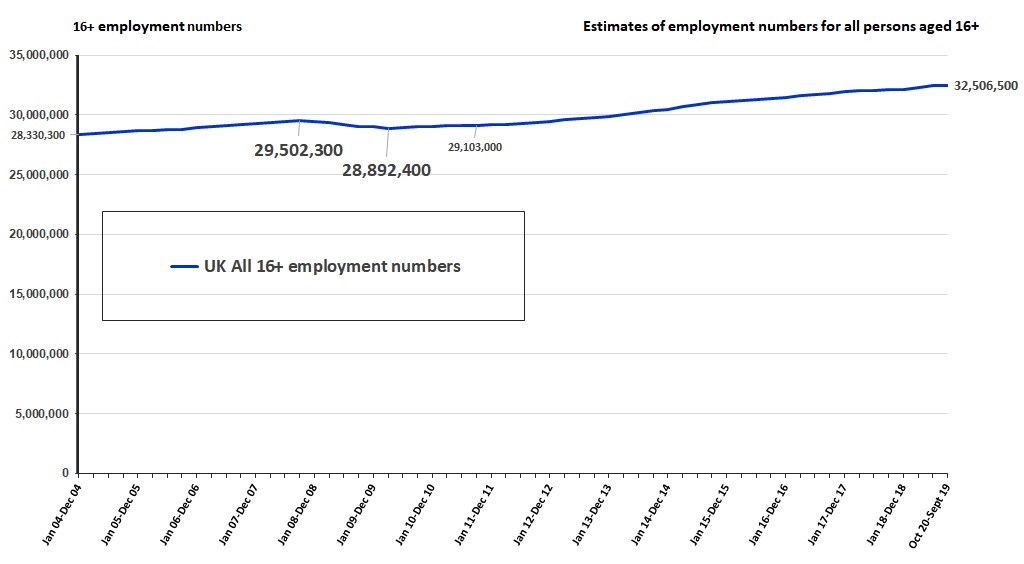
For the UK, 16+ employment was estimated at 32,506,500 persons and for the North West, 3,432,900 persons. These UK and North West 16+ employment numbers continue to rise and are the highest in the series.
Figure E2: Estimates of 16+ employment numbers (without confidence intervals) for the United Kingdom from the year ending December 2004 to the year from October 2018 to September 2019

Source: Office for National Statistics, Annual Population Survey via the National On-line Manpower Information System (N.O.M.I.S.).
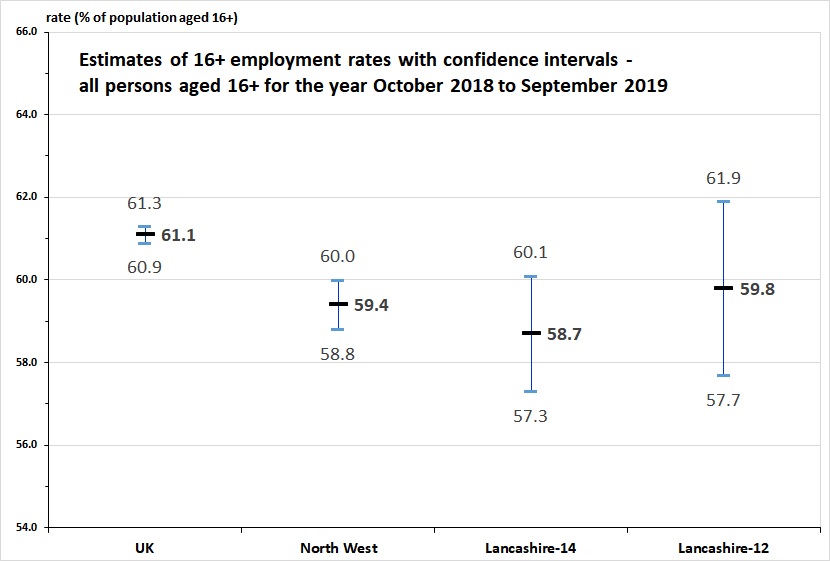
For the year ending September 2019, the Lancashire-14 estimated yearly 16+ employment rate of 58.7% (+/- 1.4%), sourced from the Annual Population Survey, is statistically lower than the estimated UK 16+ yearly employment rate of 61.1% (+/- 0.2%).
The North West yearly 16+ employment rate of 59.4% (+/- 0.6%) is also statistically lower than the UK rate.
Owing to the wide and overlapping confidence intervals, the estimated 16+ employment rate for the Lancashire-12 area of 59.8% (+/- 2.1%) was not statistically lower the UK rate. See figure E3.
Figure E3: 16+ employment rate estimates with confidence intervals for the year October 2018 to September 2019

Source: Office for National Statistics, Annual Population Survey via the National On-line Manpower Information System (N.O.M.I.S.)
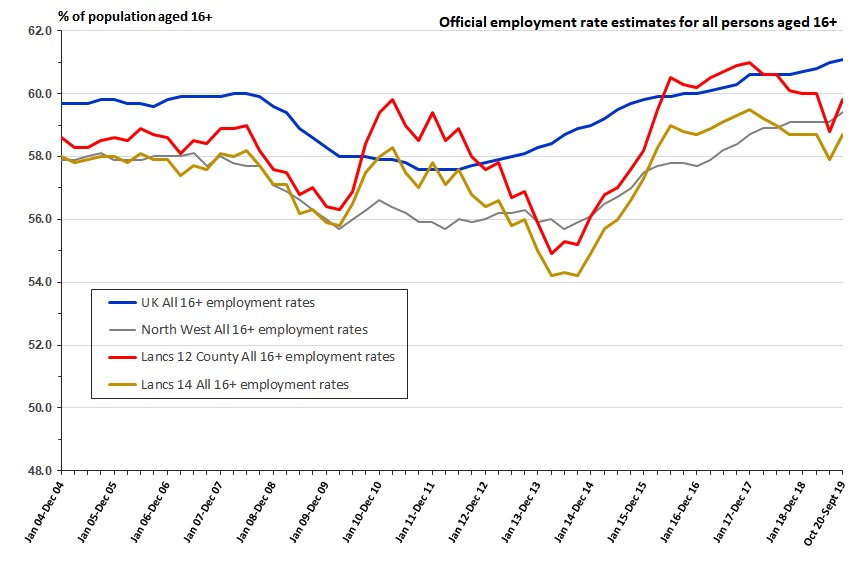
Estimated 16+ employment rates for the Lancashire-14 and Lancashire-12 areas have recovered from the year ending March 2014, and the year ending September 2014, respectively. However, they have declined since the year ending December 2017. See figure E4.
Figure E4: 16+ employment rate estimates (without confidence intervals) from the year ending December 2004 to the year ending September 2019

Source: Office for National Statistics, Annual Population Survey via the National On-line Manpower Information System (N.O.M.I.S.).
Analysis
Yearly change in 16+ employment estimates
At the UK level, 16+ employment rose by +399,800 persons (+1.2%) over the year, increasing the 16+ employment rate by +0.5 percentage points to 61.1% (+/- 0.2%).
In the Lancashire-14 area, the 16+ employment numbers rose only marginally, by 200 persons (0.0%) over the previous year.
Contrary to the UK and the Lancashire-14 area, 16+ employment numbers fell within the Lancashire-12 area (-5,100, -0.9%) over the previous year.
The yearly reduction to the 16+ employment rate in the Lancashire-12 area (-0.3 percentage points) was opposite to the UK rise of +0.5 percentage points. The 16+ employment rate for the Lancashire-14 area was the same for both the year ending September 2019 and the year ending September 2018.
Change in 16+ employment estimates since previous lows and peaks
United Kingdom change
Since the 2008/09 post-recession employment low in the UK of 28,892,400 people, estimated for the year ending March 2010, 16+ employment has increased in the UK by +3,614,100 people (+12.5%). The UK 16+ employment rate reached a low point of 57.6% (+/- 0.2) a little later than the 16+ employment numbers, for four periods, from the year ending September 2011 to the year ending June 2012. The rise in employment has increased the UK 16+ employment rate by +3.5 percentage points, from the low of 57.6% (+/- 0.2%) for the year ending June 2012, to 61.1% (+/- 0.2%) for the year ending September 2019. The number of 16+ employed persons rose to 32,506,500 for the year ending September 2019. This is a peak number for this dataset and a peak rate. The rise in the UK 16+ employment rate is significantly different in statistical terms.
UK 16+ employment has increased almost consistently since the year ending March 2010. The latest figure is +3,004,200 (+10.2%) greater than the pre-recession peak of 29,502,300, estimated for the year ending September 2008, just as the 2008/09 recession was taking hold. The UK 16+ employment rate of 61.1% (+/- 0.2%) for the year ending September 2019, is 1.1 percentage points above the pre-recession high of 60.0% (+/- 0.2%), estimated for the year ending June 2007.
16+ employment trends in the Lancashire-12 and Lancashire-14 areas
The Lancashire-12 and Lancashire-14 areas have followed parallel paths with regard to the levels of 16+ employment since the year ending December 2004. However, both have deviated from the pattern exhibited at the UK and regional level. Employment fell in all areas in the immediate aftermath of the 2008/09 recession, but the Lancashire areas then showed a sharp recovery in their 16+ employment rates from the year ending March 2010 to the year ending March 2011, when the UK rate continued to decline. The Lancashire rates subsequently declined again to low points in 2014, two years later than the UK.
Lancashire-12 changes since high and low points
Lancashire-12 change since the series high point (year ending December 2017)
In the Lancashire-12 area, 16+ employment, estimated at 568,600 persons for the year ending September 2019, has fallen by 14,700 people (-2.5%) from the peak in the series, estimated at 583,300 persons, for the year ending December 2017.
The 16+ employment rate in the Lancashire-12 area of 59.8% (+/- 2.1) for the year ending September 2019 is 1.2 percentage point lower (ignoring the +/- confidence intervals) than the peak rate in the series of 61.0% (+/- 2.1), estimated for the year ending December 2017. This is not a statistically significant change.
16+ employment trends in the Lancashire-12 area since the year ending December 2004
For the Lancashire-12 area, 16+ employment reached a pre-2008/09 recession high point for the year ending June 2008 of 549,100 persons, with a rate of 59.0% (+/- 1.8). In the aftermath of the 2008/09 recession, 16+ employment numbers hit an initial low point in December 2009 at 524,100 persons in the Lancashire-12 area. The rate was however slightly lower in the following month, for the year ending March 2010, at 56.3% (+/- 1.8). This was not a significant change in the rate statistically. 16+ employment then rallied in the Lancashire-12 area more rapidly than at the UK level, reaching 557,100 persons for the year ending December 2011. Contrary to the UK, however, where the rate continued to fall, the 16+ employment rate in the Lancashire-12 area increased to 54.9% (+/- 1.3) for the year ending December 2011. 16+ employment then fell in the Lancashire-12 area to the series low point of 517,200 persons with a rate of 54.9% (+/- 2.0) for the year ending March 2014. Employment of persons aged 16+ then recovered, reaching the series peak of 583,300 persons with a rate of 61.0% (+/- 2.1) for the year ending December 2017. Since this high point, numbers and rates have fallen in the Lancashire-12 area.
Lancashire-12 change since the low point following the 2008/09 recession (year ending March 2014)
For the year ending September 2019, 16+ employment in the Lancashire-12 area (568,600 persons) is estimated to be 51,400 (9.9%) higher than the post-recession low point of 517,200 persons (for the year ending March 2014).
The 16+ employment rate for the Lancashire-12 area of 59.8% (+/- 2.1) for the year ending September 2019 is estimated to be 4.9 percentage points higher than the post-recession low point of 54.9% (+/- 2.0), for the year ending March 2014. This increase is significantly different in statistical terms.
Lancashire-12 change since the pre-2008/09 recession high point (year ending June 2008)
The pre-2008/09 recession high point for 16+ employment in the Lancashire-12 area, estimated for the year ending June 2008, at 549,100 persons, is 19,500 persons (3.6%) lower than the latest estimate, for the year ending September 2019 of 568,600 persons.
The 16+ employment rate for the Lancashire-12 area for the year ending September 2019 at 59.8% (+/- 2.1) is estimated to be 0.8 percentage points higher than the rate of 59.0 (+/- 1.8), estimated in the area for the year ending June 2008. This difference in the rates is not significantly different in statistical terms.
Lancashire-14 changes since high and low points
Lancashire-14 change since the series high point (year ending December 2017)
For the Lancashire-14 area, 16+ employment, estimated at 695,700 persons for the year ending September 2019, has fallen by 10,300 people (-1.5%) from the peak in the series, estimated at 706,000 persons, for the year ending December 2017.
The 16+ employment rate in the Lancashire-14 area of 58.7% (+/- 1.4) for the year ending September 2019 is 0.8 percentage points lower (ignoring the +/- confidence intervals) than the peak rate in the series of 59.5% (+/- 1.4), estimated for the year ending December 2017. This is not a statistically significant change.
16+ employment trends in the Lancashire-14 area since the year ending December 2004
In the Lancashire-14 area, 16+ employment reached a pre-2008/09 recession high point for the year ending June 2008 of 670,400 persons with a rate of 58.2% (+/- 1.2). Following the 2008/09 recession, 16+ employment hit an initial low point in March 2010 of 645,700 persons with a rate of 55.8% (+/- 1.3). This was not a significant change statistically. 16+ employment then rose in the Lancashire-14 area more rapidly than at the UK level, reaching 677,400 persons for the year ending March 2011. Contrary to the UK, however, where the rate continued to fall, the 16+ employment rate increased in the Lancashire-14 area to 58.3% (+/- 1.3) for the year ending March 2011. 16+ employment then fell in the Lancashire-14 area to the series low point of 635,500 persons with a rate of 54.2% (+/- 1.4) for the ending March 2014 (the rate was also estimated at 54.2% (+/- 1.4) for the year ending September 2014 in the Lancashire14 area, although the number of 16+ employed persons was estimated at 635,800 persons). Employment of persons aged 16+ then recovered, reaching the series peak of 706,000 persons with a rate of 59.5% (+/- 1.4) for the year ending December 2017. Since this high point, numbers and rates have fallen in the Lancashire-14 area.
Lancashire-14 change since the low point following the 2008/09 recession (year ending March 2014)
For the year ending September 2019, 16+ employment in the Lancashire-14 area (695,700 persons) is estimated to be 60,200 (9.5%) higher than the post-recession low point of 635,500 persons (for the year ending March 2014).
The 16+ employment rate for the Lancashire-14 area of 58.7% (+/- 1.4) for the year ending September 2019 is estimated to be 4.5 percentage points higher than the post-recession low point of 54.2% (+/- 1.4), for the year ending March 2014. This increase is significantly different in statistical terms.
Lancashire-14 change since the pre-2008/09 recession high point (year ending June 2008)
The pre-2008/09 recession high point for 16+ employment in the Lancashire-14 area, estimated for the year ending June 2008, at 670,400 persons, is 25,300 persons (3.8%) lower than the latest estimate, for the year ending September 2019 of 695,700 persons.
The 16+ employment rate for the Lancashire-14 area for the year ending September 2019 at 58.7% (+/- 1.4) is estimated to be 0.5 percentage points higher than the rate of 58.2 (+/- 1.2), estimated in the area for the year ending June 2008. This difference in the rates is not significantly different in statistical terms.
Important note on the interpretation of the data
Please note that local data below the regional level is less accurate and can be volatile, owing to the smaller sample sizes and this may explain some of the variation in data. These figures should be viewed as estimates, rather than definitive data and caution applied in their interpretation. It is also advisable to revisit subsequent releases of the data to ascertain if the trends continue, or whether some of the figures may be a result of statistical anomalies.
Page updated 3 April 2020.