England and Wales local authority maps
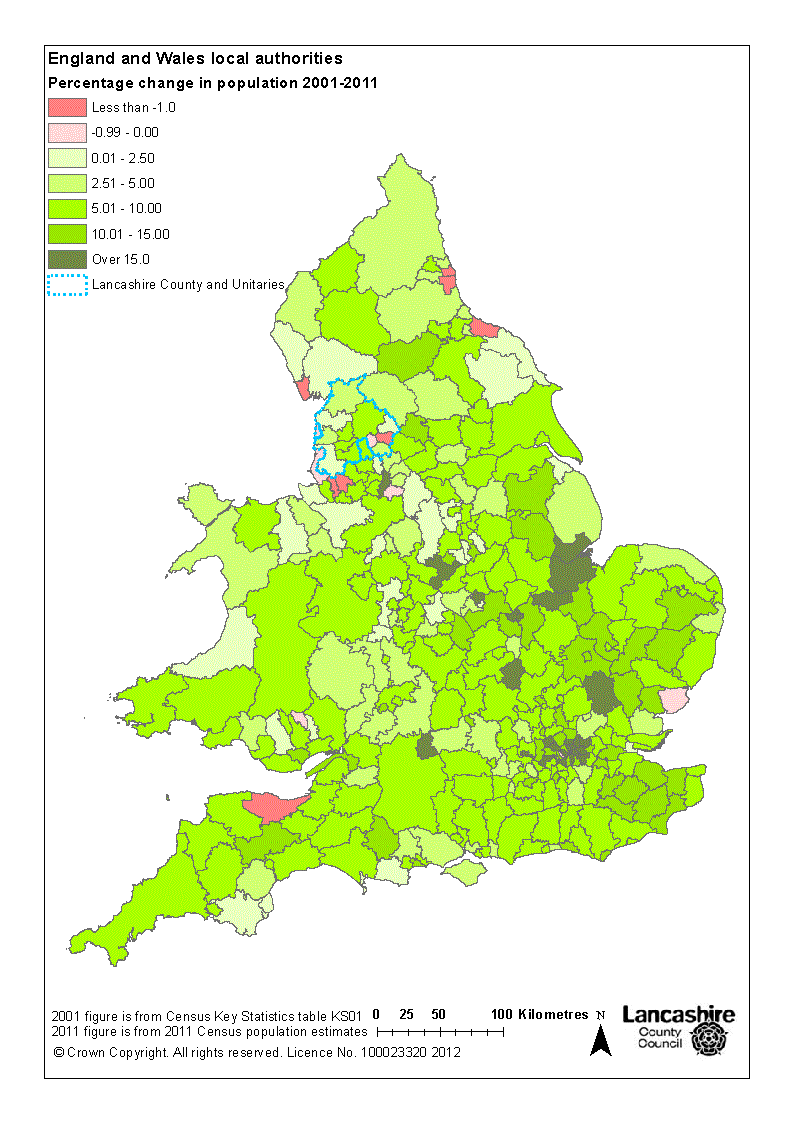
 Population change, 2001 to 2011
This map highlights the population change since the 2001 Census. Most of the authorities with declining populations are in Lancashire and the North West whereas most of the rapidly growing populations are in London Authorities and those in the South East.
The full size Adobe pdf version of this map can be downloaded below or by clicking on the image, and if you have the facility to operate the Object Data Tool in Adobe Reader you can see the data for each local authority and its location. If the map opens in your browser window, the full functionality of the pdf will not be available. To get round this you will have to save the file instead of immediately opening it, then you can change the open option to 'open with', at which point you choose Adobe Reader if you have it installed.
Download the full document here (PDF 1,141 kB)
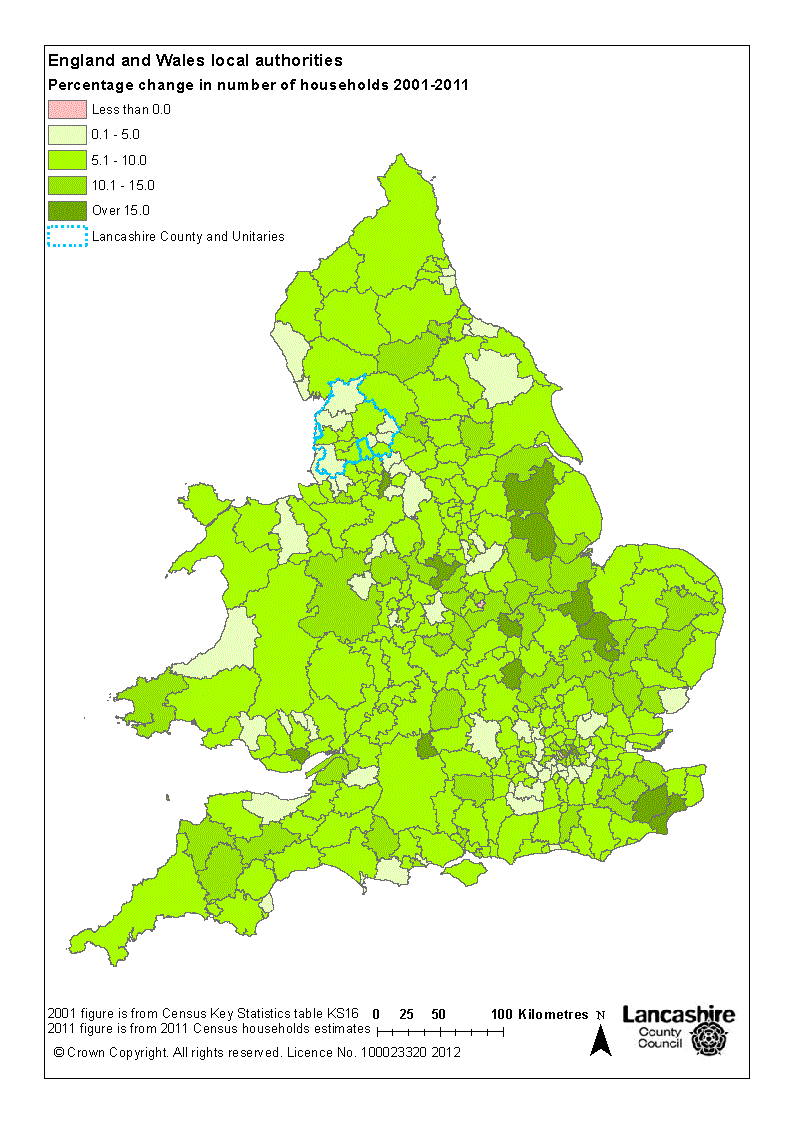
Household change, 2001 to 2011
This map shows the change in number of households with at least one resident. Whereas there were a number of local authorities in the North West and North East where the population has declined, none of these have experienced a reduction in households. This may reflect a decline in the household size.  As the 2011 estimates are rounded to the nearest 100, but the 2001 figures are exact, decreases smaller than 0.2% have not been shaded pink to imply a decline in numbers. Oadby and Wigston in Leicestershire and Kensington and Chelsea in London are the only authorities with a tangible decline.
The full size Adobe pdf version of this map can be downloaded below or by clicking on the image, and if you have the facility to operate the Object Data Tool in Adobe Reader you can see the data for each local authority and its location. If the map opens in your browser window, the full functionality of the pdf will not be available. To get round this you will have to save the file instead of immediately opening it, then you can change the open option to 'open with', at which point you choose Adobe Reader if you have it installed.
Download the full document here (PDF 1,148 kB)
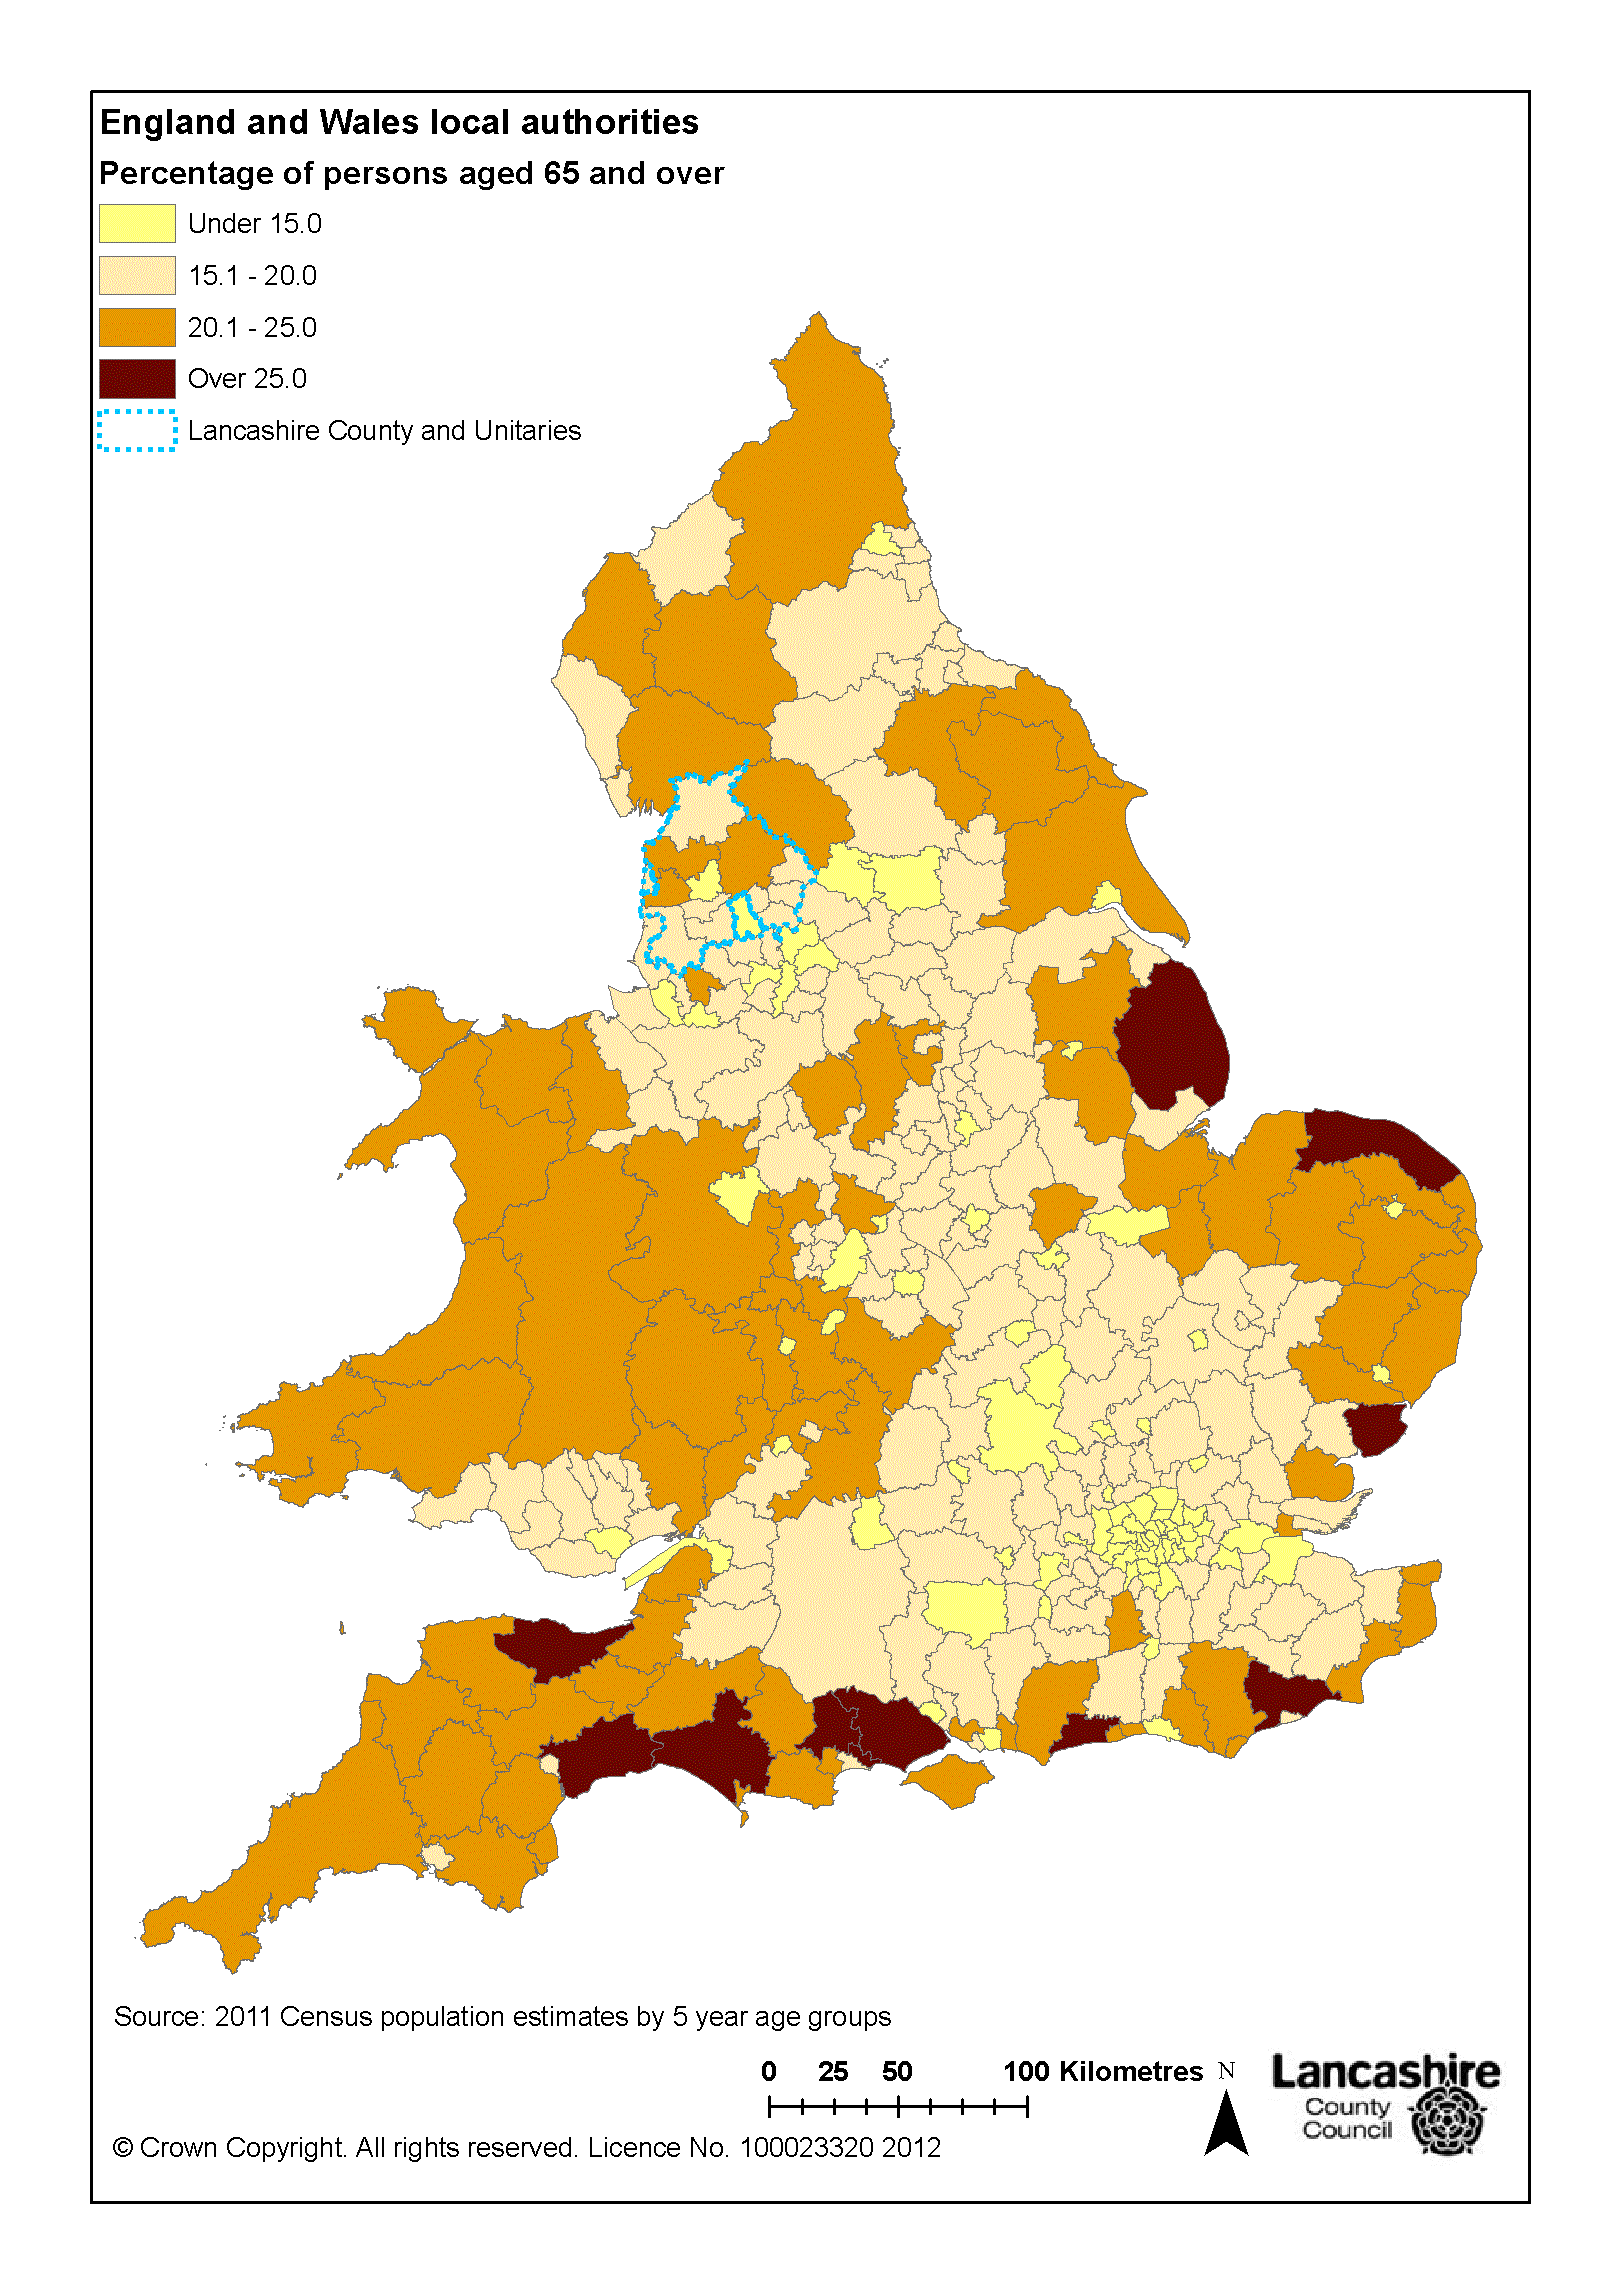
Percentage of persons aged 65 and over
This map shows the local authorities in England and Wales shaded according to percentage of usual residents aged 65 and over.
The full size Adobe pdf version of this map can be downloaded  below or by clicking on the image, and if you have the facility to operate the Object Data Tool in Adobe Reader you can see the data for each local authority and its location. If the map opens in your browser window, the full functionality of the pdf will not be available. To get round this you will have to save the file instead of immediately opening it, then you can change the open option to 'open with', at which point you choose Adobe Reader if you have it installed.
Download the full document here (PDF 1,081 kB)