Claimant Count figures
As from the July 2022 Claimant Count data release, the analysis provided below by Lancashire County Council Business Intelligence will focus on the revised (final) Claimant Count data. However, a brief description of the latest provisional percentage change in Claimant Count numbers will be outlined to provide an idea of whether the data is decreasing or increasing.
Skip to the summary analysis of the revised (final) Claimant Count data
Skip to our Claimant Count Microsoft Power BI report (data and time series graphs)
Skip to the Microsoft Excel Claimant Count data file
The Claimant Count data is available via the National Online Manpower Information System (Nomisweb) data selection tool. Please note that the provisional data is usually revised with the next release of data (in the following month).
The introduction of Universal Credit (UC) in 2013 has resulted in inconsistencies in the coverage of the Claimant Count across the UK, owing to the different speeds of the UC roll out. The Claimant Count figures have consequently been re-classified as experimental statistics by the Office for National Statistics (ONS). This status is likely to continue until the roll out of Universal Credit is completed - currently expected in September 2024. Care should therefore be taken when analysing and interpreting the figures.
From April 2015, the Claimant Count has included all claimants of Jobseeker's Allowance (JSA), plus those Universal Credit claimants who were required to seek work and be available for work.
Please note that enhancements to Universal Credit as part of the UK government's response to the coronavirus mean that an increasing number of people became eligible for unemployment-related benefit support, although still employed. Consequently, changes in the Claimant Count will not be wholly because of changes in the number of people who are unemployed. The ONS is not able to identify to what extent people who are employed or unemployed have affected the numbers.
Under Universal Credit a broader span of claimants are required to look for work than under JSA. As Universal Credit full service areas are rolled out across the UK, the number of people recorded as being on the Claimant Count is therefore likely to rise in those areas where full service has been implemented.
Click here for our Claimant Count Microsoft Power BI report (data and time series graphs).
Please see the 'Additional things you need to know about the data' section below for information on the impact of Universal Credit on JSA numbers, provisional and revised data, and updates to the denominators.
February 2024 provisional percentage change in Claimant Count numbers
In February 2024, the provisional number of persons aged 16-64 on the Claimant Count rose by 3.9% in the Lancashire-12 area and by 4.1% in the Lancashire-14 area. These increases are similar to the United Kingdom percentage rise of 4.0%. Eleven of the Lancashire-14 local authority areas also saw provisional increases to their totals and three areas saw decreases. Please note that the provisional monthly changes for February 2024 reported above will probably be lower in extent when the revised (final) figures are released next month. Any provisional changes may be reduced in extent, or even reversed (to show overall decreases) when the revised figures are published.
The provisional figures and provisional monthly change data can be found in the Microsoft Power BI report below and the Excel data file at the bottom of the web page.
Summary analysis of January 2024 revised (final) data
Lancashire-12 and Lancashire-14 areas
In January 2024, the revised proportion of persons aged 16-64 on the Claimant Count was 3.6% in the Lancashire-12 area. This was marginally lower than the United Kingdom proportion of 3.7%. However, the proportions for the Lancashire-14 area (4.0%) and the North West region (4.1%) were above the UK figure.
Figure 1: Claimant Count proportions (residents aged 16 to 64) - January 2007 to January 2024 (revised)
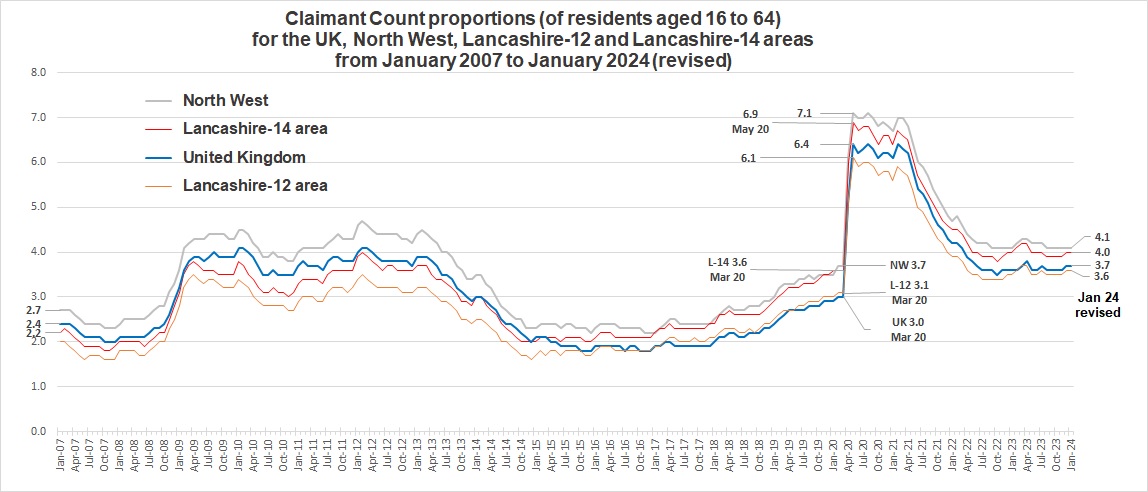
Source: Office for National Statistics via the National On-line Manpower Information System (Nomisweb).
District summary
Five of the six local authority areas in the east of the Lancashire-14 area, plus Blackpool and Preston in the west of the area have proportions above the UK proportion.
Figure 2: Claimant Count proportions (percentages of working age residents aged 16 to 64) - January 2024 (revised)
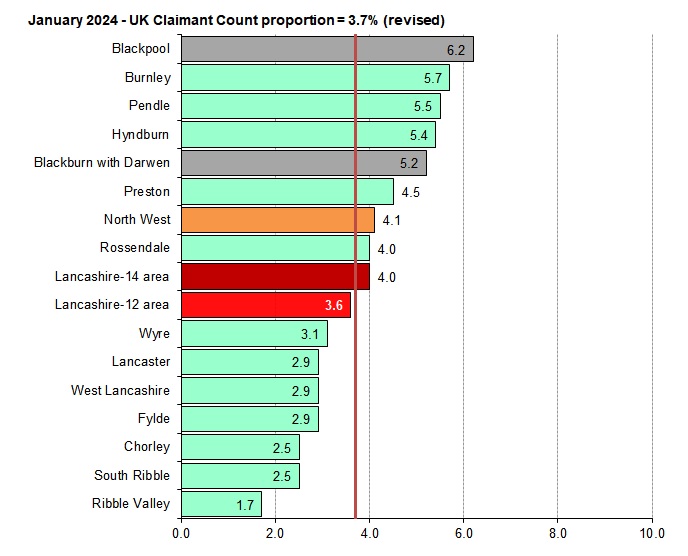
Source: Office for National Statistics via the National On-line Manpower Information System (Nomis).
Blackpool, in the Lancashire-14 area, had a revised proportion of 6.2% in January 2024 - this was the sixth joint highest in the UK - out of 374 local authority areas (UK = 3.7%). Blackpool's proportion in January 2024 was 1.1 percentage points lower than the proportion in March 2020 (7.3%), just as the Covid-19 pandemic was taking off.
Blackpool and Lancaster are the only Lancashire-14 areas that have Claimant Count proportions in January 2024 that are lower than the proportions recorded in March 2020. Lancaster's proportion in January 2024 (2.9%) is 0.2 percentage points lower than March 2020 (3.1%).
The Claimant Count in Blackpool reached a low point during 2023 in October (5,075 people, proportion = 5.8%). Since then, Blackpool has shown the usual seasonal uptick to the Claimant Count between November 2023 and Jan 2024 (up 330 people (6.5%), proportion up 0.4 percentage points) as tourism and seasonal Christmas related employment reduces from late autumn and winter months.
The revised proportion for Burnley (5.7%) in January 2024 was ranked in the top 22 places and fell within the highest 6% of the UK rankings. The proportion for Pendle (5.5%) fell within the highest 8% of the rankings. The proportions for Hyndburn (5.4%) and Blackburn with Darwen (5.2%) fell within the highest 10% of the UK rankings. Preston's proportion (4.5%) fell in the top sixth of the rankings and Rossendale's (4.0%) fell just outside the highest quarter. Ribble Valley (1.7%) had the lowest proportion in the Lancashire-14 area, the second lowest in the North West region and was the fourth joint-lowest in the UK.
The Claimant Count proportions for Pendle and Hyndburn at January 2024 are 1.8 percentage points and 0.9 percentage points greater than they were in March 2020. These are the only two Lancashire-14 areas to have proportions that differ by more than the 0.7 percentage point increase recorded for the UK proportion between March 2020 (3.0%) and March 2023 (3.7%).
In the Lancashire-12 area, Preston (4,365) had the largest revised Claimant Count total in January 2024, followed by Burnley (3,340), Pendle (3,200), Hyndburn (2,750) and Lancaster (2,630). Ribble Valley (640) had the lowest total.
The revised Claimant Count totals for Blackpool (5,405) and Blackburn with Darwen (5,035) were greater than all of the Lancashire-12 individual areas.
Lancashire-12 summary
For the Lancashire-12 area, the revised Claimant Count total was 27,570 persons in January 2024 (proportion = 3.6%). Of the total, 15,990 were men and 11,580 were women. The proportion for men (4.3%) was higher than that for women (3.0%). Males in the Lancashire-12 area accounted for 58.0% of the Claimant Count total.
The Lancashire-12 Claimant Count total in January 2024 was up by 425 persons (1.6%) on the previous month; the proportion was unchanged. The total was 18,120 people (-39.7%) lower than the recent peak in May 2020 of 45,690 persons. The proportion was 2.5 percentage points lower than in May 2020 (6.1%). The Lancashire-12 total is 19.9% (4,570 people) greater than the March 2020 total of 23,000 people. The January 2024 proportion (3.6%) is 0.5 percentage points higher than the 3.1% recorded in March 2020.
Figure 3: Claimant Count numbers - January 2007 to January 2024 (revised)
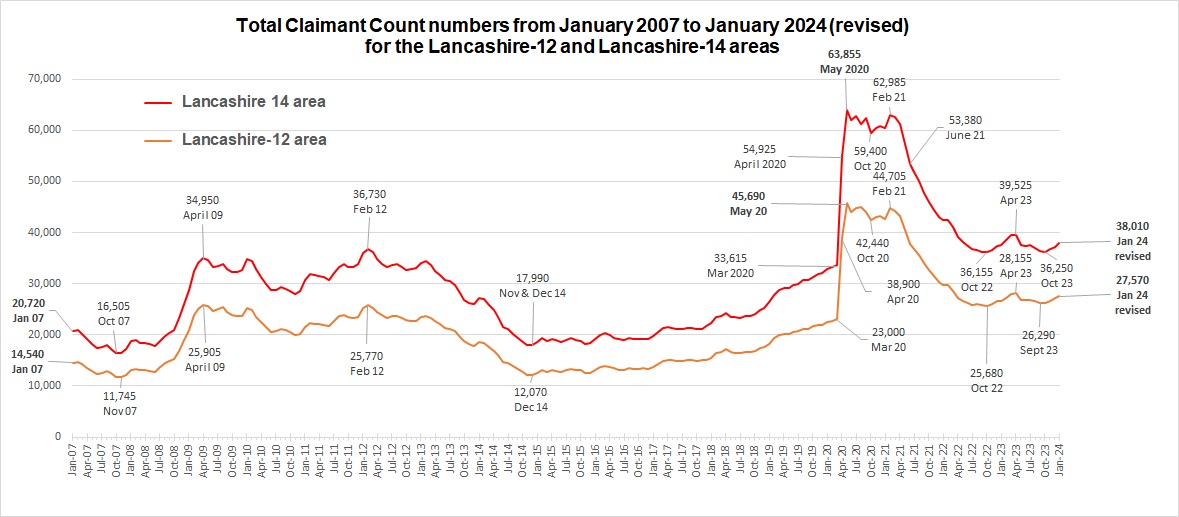
Source: Office for National Statistics via the National On-line Manpower Information System (Nomisweb).
Lancashire-14 summary
The revised Claimant Count total for the Lancashire-14 area was 38,010 persons in January 2024 (proportion = 4.0%). Of the total, 22,225 were men and 15,790 were women. The proportion for men (4.8%) was higher than that for women (3.3%). Males accounted for 58.5% of the Claimant Count total.
The Lancashire-14 Claimant Count total was up by 785 persons (2.1%) on the previous month; the proportion was unchanged. The total was 25,845 people (-40.5%) lower than the recent peak in May 2020 of 63,855 persons. The proportion was 2.9 percentage points lower than in May 2020 (6.9%). The Lancashire-14 total is 13.1% (4,395 people) greater than the March 2020 total of 33,615 people. The January 2024 proportion (4.0%) is 0.4 percentage points higher than the 3.6% recorded in March 2020.
UK summary
At the UK level, the revised Claimant Count total was 1,551,970 persons in January 2024 and the proportion was 3.7%. Of the UK total, 879,920 were men and 675,050 were women. The proportion for men (4.2%) was higher than that for women (3.1%). Males accounted for 56.7% of the Claimant Count total.
The Claimant Count total for the United Kingdom increased by 8,510 persons (0.6%) on the previous month (December 2023); the proportion was unchanged. The January 2024 total was 1,109,370 people (-41.7%) lower than the initial peak in August 2020 of 2,688,110 persons recorded in the aftermath of the initial Covid-19 lock-down. The proportion was 2.7 percentage points lower than in August 2020 (6.4%). The UK Claimant Count proportion peaked at 6.4% in May and August in 2020, and also in February and March in 2021, but the numbers peaked in August 2020. The UK total in January 2024 is 22.3% (283,350 people) greater than the March 2020 total of 1,268,620 people. The proportion (3.7%) is 0.7 percentage points higher than the 3.0% recorded in March 2020.
North West summary
For the North West region, the Claimant Count total was 191,595 persons in January 2024 (proportion = 4.1%). Of the North West total, 112,730 were men and 78,865 were women. The proportion for men (4.9%) was higher than that for women (3.4%). Males accounted for 58.8% of the Claimant Count total.
The January 2024 Claimant Count total for the North West region was up by 900 persons (0.5%) on the previous month; the proportion was unchanged. The total was 134,895 people (-41.3%) lower than the recent peak in May 2020 of 326,490 persons. The January 2024 proportion was 3.0 percentage points lower than in May 2020 (7.1%). The North West total is 12.8% (21,730 people) greater than the March 2020 total of 169,865 people. The proportion (4.1%) is 0.4 percentage points higher than the 3.7% recorded in March 2020.
Microsoft Power BI Report
Table 1: Total Claimant Count numbers [1] and proportions (%) [2] (16-64) [3], February 2024 (provisional) and January 2024 (revised), plus provisional monthly changes, revised monthly and yearly changes - and revised changes from May 2020 and March 2020.
Table 2: Male Claimant Count data. Table 3: Female Claimant Count data.
Graph 1: Claimant Count numbers for Lancashire areas. Graph 2: Claimant Count numbers for the UK, England and the North West
Graph 3: Claimant Count monthly proportions for the UK, England and the North West (from January 2007)
[1] All Claimant Count numbers are rounded to the nearest 5. Claimant Count numbers may not sum exactly to the combined number of people claiming JSA (published on Nomis) and the number of people claiming Universal Credit and required to seek work (published by DWP), owing to independent rounding.
[2] Proportions of the resident working age populations for local authorities, regions and countries from January 2021 onwards are calculated using the mid-2021 resident population aged 16-64.
[3] Prior to June 2016, the number of persons aged 65 or over contained within the UK Claimant Count figures was very small (25 or fewer (0.0016% of the total). Between June 2016 and December 2018 numbers rose from 30 to 880. From January 2019 to March 2020 the number of persons aged 65 or over on the Claimant Count increased from 2,045 to 11,905. From March 2020, the number rose to a peak of 34,365 in March 2021 (1.28% of the total). Since this date, the number of persons aged 65 or over on the Claimant Count in the UK has fallen to 25,370 in March 2023 (or 1.56% of the Claimant Count total).
In the Lancashire-14 area, the number of persons aged 65 or over on the Claimant Count was 5 or fewer until November 2018. Between December 2018 and March 2020, the number of persons aged 65 or over on the Claimant Count rose from 10 to 320 persons (0.95% of the total). From March 2020, the number rose to a peak of 800 in January and February of 2021 (1.33% of the total in January 2021). Since this date the number of persons aged 65 or over on the Claimant Count in the Lancashire-14 area has fallen to 600 (or 1.52% of the Claimant Count total) as at March 2023.
Source: Office for National Statistics via the National On-line Manpower Information System (Nomis), Claimant Count dataset.
Monthly changes to the revised Claimant Count numbers
Between December 2023 and January 2024, the monthly percentage increases in Claimant Count numbers in the Lancashire-14 area (2.1%) and the Lancashire-12 area (1.6%) were higher than the UK rise (0.6%) and the North West increase (0.5%).
Ten of the Lancashire-14 areas saw monthly increases to their Claimant Count totals, ranging from rises of 6.3% in Pendle and 3.7% in Blackburn with Darwen, down to 1.5% in Wyre. Rossendale saw no change over the month.
Three of the Lancashire-14 areas recorded monthly percentage decreases to their Claimant Count totals, ranging from -1.1% in Preston, -1.5% in Lancaster, to -5.2% in Ribble Valley.
Pendle (up 190 people, 6.3%) saw the largest monthly increase to its Claimant Count total in the Lancashire-14 area, followed by Blackburn with Darwen (up 180 people, 3.7%) and Blackpool (up 180 people, 3.4%). Rossendale saw no change over the month.
Preston (down 50 people, -1.1%) recorded the largest monthly decrease to its Claimant Count total in the Lancashire-14 area, followed by Lancaster (down 40 people, -1.5%) and Ribble Valley (down 35 people, -5.2%).
Monthly changes to the revised Claimant Count proportions
The proportions for the Lancashire-12 area (3.6%), the UK (3.7%), the Lancashire-14 area (4.0%) and the North West (4.1%) were unchanged between December 2023 and January 2024.
Within the Lancashire-12 area, eight of the twelve local authority areas recorded monthly increases to their proportions. The proportion for Pendle increased by 0.3 percentage points. The proportions for the seven areas each rose by 0.1 percentage point. The proportion for Rossendale was unchanged. The proportions for Preston, Lancaster and Ribble Valley each fell by 0.1 percentage point over the month.
The proportions for Blackburn with Darwen and Blackpool each rose by 0.2 percentage points between December 2023 and January 2024.
Yearly changes in the revised Claimant Count numbers and proportions
Please see the Microsoft Power BI report above (Tables 1 to 3 and Graphs 1 to 3) for the yearly change in the revised Claimant Count numbers and proportions.
Claimant Count change analysis since the Covid -19 pandemic
Claimant Count numbers increased dramatically between March 2020 and May 2020 as the initial Covid-19 lockdown resulted in a deep economic recession.
The Claimant Count numbers eventually decreased at a fairly fast pace from the respective Covid-19 pandemic peak Claimant Count numbers that were recorded between May 2020 and April 2021. The reductions to the Claimant Count totals from early 2021 to the summer and autumn months of 2022 reflect the opening up of the UK economy after the Covid-19 lockdown restrictions were lifted and also the recovery of seasonal tourism employment.
The cessation of the furlough scheme at the end of September 2021 did not cause an additional surge in Claimant Count numbers in the autumn and the winter months of 2021/22.
Change in the Claimant Count from the low points in 2022
The pace of the reduction in Claimant Count numbers appeared to slow over the summer and autumn of 2022 in the UK. The usual uptick in Claimant Count numbers from the late autumn of 2022 to the early spring of 2023 was evident. The seasonal upturn in the Claimant Count usually reflects the reduction in tourism and festive employment that occurs over the autumn and winter months.
Claimant Count numbers and proportions appear to have stabilised since 2022 in the UK, North West, Lancashire-12 and Lancashire-14 areas – although the usual autumn and winter seasonal upticks are still apparent in 2022/23 and 2023/24. However, some of the local authorities within the Lancashire-14 area have recorded greater deviations. Pendle and Burnley have seen notable increases, whilst Blackpool has recorded a decrease.
Since the Claimant Count low points recorded over the summer and autumn months of 2022, the Claimant Count proportion for the UK in January 2024 (3.7%) is 0.2 percentage points higher than the UK proportion recorded in October 2022 (3.5%). The Lancashire-12 proportion is also 0.2 percentage points higher (up from 3.4% to 3.6)%. The Lancashire-14 proportion is 0.2 percentage points greater (up from 3.8% to 4.0%). The North West proportion is unchanged, being 4.1% in both October 2022 and January 2024. The Lancashire-12 area, the Lancashire-14 area, the North West and UK all recorded their 2022 low points in October of that year.
Within the Lancashire-14 area, the Claimant Count proportion for Pendle has risen by the greatest amount since the 2022 low points, increasing by 0.9 percentage points, from 4.6% in September 2022, to 5.5% in January 2024. In Burnley, the proportion has increased by 0.8 percentage points, from 4.9% in October 2022, to 5.7% in January 2024. In Hyndburn, the proportion has risen by 0.4 percentage points, from 5.0% in November 2022, to 5.4% in January 2024. Preston's proportion has increased by 0.3 percentage points, from 4.2% in October and November of 2022, to 4.5% in January 2024. For Fylde, the proportion has risen by 0.3 percentage points, from 2.6% in September 2022, to 2.9% in January 2024.
South Ribble, Wyre and Blackburn with Darwen have seen increases to their proportions of 0.2 percentage points since their respective 2022 low points. The proportions for Rossendale, West Lancashire and Ribble Valley are each 0.1 percentage points higher in January 2024. The proportions for Chorley and Lancaster have the same proportions in January 2024 as they did in the months of their respective 2022 low points.
Although having one of the highest proportions in the UK, Blackpool is the only Lancashire-14 local authority area to have seen a reduction to its proportion since its 2022 low point, falling from 6.5% in October 2022, to 6.2% in January 2024.
Claimant Count peaks following the Covid-19 pandemic
Claimant Count numbers increased dramatically between March 2020 and May 2020 as the initial Covid-19 lockdown resulted in a deep economic recession.
The initial and highest peaks in Claimant Count numbers were recorded in May 2020 for the Lancashire-12 area (45,690), the Lancashire-14 area (63,855) and the North West region (326,490). The initial peak for the UK Claimant Count total occurred a little later, in August 2020 (2,688,110 persons). The peak pandemic UK proportion (6.4%) was however reached four times - in May 2020, August 2020, February 2021 and March 2021. The North West peak pandemic proportion (7.1%) was also recorded four times – again in May 2020, August 2020, February 2021 and March 2021.
Within the Lancashire-14 area, the Covid-19 pandemic peaks in Claimant Count numbers and proportions also occurred in May 2020 in nine of the local authority areas. These areas were Chorley, Fylde, Lancaster, Preston, Ribble Valley, Rossendale, South Ribble, West Lancashire and Wyre. Please note, however, that both the peak Claimant Count number and proportion in West Lancashire were also repeated in August 2020. In Wyre, the Claimant Count total was almost reached again in February 2021 (its proportion was the same in February 2021 as in May 2020). In Preston, the peak Claimant Count total in May 2020 was almost reached again in July 2020, August 2020, February 2021 and March 2021. However, Preston's peak proportion in May 2020 (6.9%) was not repeated in these four months, recording 6.8% in the subsequent months.
Five of the Lancashire-14 areas had Claimant Count totals and proportions in early 2021 (February 2021, March 2021 and April 2021) that surpassed their initial Covid-19 peaks recorded in 2020. Claimant Count totals peaked in February 2021 in Blackpool, Burnley and Hyndburn. The total for Blackburn with Darwen peaked in March 2021, whilst Pendle's total peaked in April 2021.
Impact of the Universal Credit full service roll out on the Claimant Count
Please note that Lancaster became a Universal Credit full service area in July 2016 - the first in the Lancashire-14 area. This means that persons can process Universal Credit claims online, rather than via the phone. More complex claims are also processed. The result was an acceleration in the number of people claiming Universal Credit in Lancaster (in addition to substantial upward revisions over the summer months of 2016).
A further impact in Lancaster has been the accelerated reduction in claimants of Jobseeker's Allowance (JSA) since July 2016. The number of claimants in Lancaster fell by 76.3% (or 648 persons) from to 849 people in July 2016, to 201 persons in July 2019. However, the majority of this reduction occurred in the first year, from July 2016 to July 2017, when numbers fell by 63.7% (541 persons), from 849 people in July 2016, to 308 persons in July 2017. Other benefits that are being replaced by Universal Credit may also be similarly affected.
Burnley became a Universal Credit full service area in May 2017, West Lancashire in December 2017 and Blackburn with Darwen and Hyndburn in February 2018. Preston and South Ribble became Universal Credit full service areas in March 2018 and Chorley in April 2018. Pendle, Ribble Valley and Rossendale all became Universal Credit full service areas in July 2018. Fylde, Wyre and Blackpool transitioned to UC full service areas in September 2018.
A similar impact on Universal Credit numbers and JSA claimants to that experienced in Lancaster has been seen in these local authority areas over the last two years.
Claimant Count data versus official unemployment and small area data
Please note that the Claimant Count does not measure official unemployment. Official unemployment has a wider definition and includes those economically active unemployed persons who meet the definition criteria, and who do not claim benefits, either through choice, or for reasons of non-eligibility. Official unemployment figures therefore tend to be somewhat higher than the Claimant Count.
Official unemployment data is not available below the district/unitary authority level, whereas Claimant Count data is available for small geographic areas such as wards and smaller lower-layer super output areas (LSOAs). The Claimant Count therefore provides a good proxy for unemployment at the small local level. Generally, a high Claimant Count in an area is a good indicator of high unemployment in that area.
Information about the wider labour market can be found in the monthly statistical bulletins produced by the ONS on the UK labour market and the regional labour markets in the UK.
Monthly changes to the Claimant Count numbers and proportions between March and May 2020
Owing to the lockdown in response to the coronavirus pandemic, whereby a large proportion of the UK population were initially advised to stay at home, or work from home, to slow the spread of the virus, the UK economy experienced a sharp and deep recession. Recovery of the economy to pre-pandemic levels is projected to be achieved by the end of 2021 (assuming the Covid-19 virus does not cause further problems). The economic downturn has been reflected in the Claimant Count of unemployment related benefits.
UK monthly changes from March to May 2020
Between March 2020 and April 2020, the UK revised Claimant Count total rose by a staggering 66.6% (844,940 persons) from 1,268,620 in March 2020 to 2,113,560 persons in April 2020. The Claimant Count proportion rose by 2.1 percentage points from 3.0% to 5.1% in April 2020. These figures compared with an increase between March 2019 and April 2019 (revised) of 14,805 persons (1.4%) and a rise in the proportion of 0.1 percentage point from 2.6% to 2.7% a year earlier.
Between April 2020 and May 2020, the revised figures showed that the UK Claimant Count again increased by a substantial number, rising by 25.9% (547,780 persons), from 2,113,560 in April 2020 to 2,661,340 persons in May 2020. The Claimant Count proportion rose by 1.3 percentage points from 5.1% to 6.4% in May 2020.
Overall, for the two months between March 2020 and May 2020, the UK Claimant Count total increased by 109.8% (+1,392,720 persons), more than doubling, from 1,268,620 persons in March 2020 to 2,661,340 persons in May 2020. The UK proportion rose by 3.4 percentage points from 3.0% in March 2020 to 6.4% in May 2020.
Lancashire-12 monthly changes from March to May 2020
The Lancashire-12 area saw its revised Claimant Count total rise by a greater 69.1% (15,900 persons) from 23,000 people in March 2020 to 38,900 people in April 2020. The UK rise was 66.6%. The Claimant Count proportion rose by 2.1 percentage points from 3.1% to 5.2% in April 2020. These figures compared with an increase between March 2019 and April 2019 (revised) of 265 persons (1.3%) and no change to the proportion (2.7%) a year earlier. The UK proportion also increased by 2.1 percentage points between March 2020 and April 2020 to 5.1%.
Between April 2020 and May 2020, the revised Lancashire-12 Claimant Count rose by 17.5% (6,790 persons) from 38,900 persons to 45,690 persons. This was lower than the 25.9% increase at the UK level over that period. The Lancashire-12 Claimant Count proportion rose by 1.0 percentage points from 5.2% to 6.2% in May 2020. The UK proportion rose by a greater 1.3 percentage points over the month to 6.4%.
Overall, for the two months between March 2020 and May 2020, the Lancashire-12 Claimant Count total increased by 98.7% (+22,690 persons), almost doubling, from 23,000 persons in March 2020 to 45,690 persons in May 2020. The Lancashire-12 proportion rose by 3.1 percentage points from 3.1% in March 2020 to 6.2% in May 2020. This was lower than the UK proportion increase of 3.4 percentage points to 6.4% in May 2020.
Lancashire-14 monthly changes from March to May 2020
For the Lancashire-14 area, the revised Claimant Count total increased by 63.4% (21,310 persons), from 33,615 persons in March 2020 to 54,925 persons in April 2020. This was lower than the UK rise of 66.6% and the Lancashire-12 increase of 69.1%. The Lancashire-14 Claimant Count proportion rose by 2.3 percentage points from 3.7% to 6.0% in April 2020. The rise in the Lancashire-14 proportion was greater than the UK and Lancashire-12 increases of 2.1 percentage points. These Lancashire-14 increases compare with a rise between March 2019 and April 2019 (revised), a year earlier, of 1.5% (420 persons) and an increase in the proportion of 0.1 percentage point. Please note that the Lancashire-14 Claimant Count proportion was 3.7% in March 2020, compared to 3.0% for the UK. The relatively higher Claimant Count numbers in the Lancashire-14 area in March 2020, probably account for the lower percentage rise in numbers over the month.
The revised figures show that between April 2020 and May 2020, that the Lancashire-14 Claimant Count total increased by 16.3% (8,930 persons), from 54,925 persons in April 2020, to 63,855 persons in May 2020. Again, this was lower than the 25.9% increase at the UK level and the 17.5% increase for the Lancashire-12 area between these two months. The Lancashire-14 Claimant Count proportion rose by 0.9 percentage points from 6.0% to 6.9% in May 2020. The UK proportion rose by a greater 1.3 percentage points over the month, but to a lower 6.4%. The Lancashire-12 Claimant Count proportion rose by a marginally greater 1.0 percentage point, but to a lower 6.2% in May 2020.
Overall, for the two months between March 2020 and May 2020, the Lancashire-14 Claimant Count total increased by 90.0% (+30,240 persons), almost doubling, from 33,615 persons in March 2020 to 63,855 persons in May 2020. This percentage rise in numbers was lower than the UK increase of 109.8% and the Lancashire-12 rise of 98.7%. The Lancashire-14 proportion rose by 3.2 percentage points from 3.7% in March 2020 to 6.9% in May 2020. This was lower than the UK proportion increase of 3.4 percentage points over the two months. However, the UK rise was to the lower 6.4% in May 2020. The Lancashire-14 rise to its proportion was marginally greater than the Lancashire-12 rise of 3.1 percentage points over the two months. The Lancashire-12 Claimant Count proportion increased to 6.2% in May 2020.
Overview of the initial impact of the Coronavirus lockdown on the revised Claimant Count proportions at the district level between March and May 2020
Following the Coronavirus lockdown on the 23 March 2020, the increase in Claimant Count numbers appears to have been more immediate across the Lancashire-14 areas than in some other areas of the UK, occurring between March 2020 and April 2020 (rather than between April 2020 and May 2020).
Between March 2020 and April 2020, all 379 local authority areas in the UK saw increases in their Claimant Count proportions. The revised increases in the UK ranged between 5.3 percentage points in the Isles of Scilly, to 0.9 percentage points in Cambridge and South Cambridgeshire, both in the East of England (UK = +2.1 percentage points). The increases for eight of the Lancashire-14 areas were ranked in the top 139 places (or highest 37% of the 379 local authorities). Blackpool had the second greatest increase in the UK between March 2020 and April 2020 (rising by 3.9 percentage points). The increases for Hyndburn, Fylde, Rossendale, Wyre, Pendle, Burnley and Blackburn with Darwen ranged between +2.7 percentage points to +2.2 percentage points.
Between April 2020 and May 2020, all 379 local authority areas in the UK once again recorded increases in their Claimant Count proportions. The revised increases in the UK ranged between 4.1 percentage points in the London borough of Newham, to 0.3 percentage points in Dumfries and Galloway, the Orkney Islands and the Shetland Islands in Scotland, Belfast in Northern Ireland, and Ryedale in the Yorkshire and the Humber region (UK = +1.3 percentage points). Only one Lancashire-14 area had an increase to its Claimant Count proportion that was ranked in the highest 130 places (top 35%) - this was Burnley, where the Claimant Count proportion rose by 1.3 percentage points. However, the Claimant Count proportions for Blackpool, Blackburn with Darwen, Preston and Pendle each rose by 1.2 percentage points (in the top 162 positions, or the highest 43%). The increases for Hyndburn, Rossendale, Fylde, Wyre, where each rose by 1.0 percentage point, and fell in the top 58% of the rankings (the highest 217 positions).
Additional things you need to know about the data
The impact of Universal Credit on JSA numbers
Generally, the number of JSA claimants has reduced as Universal Credit has been rolled out. However, the number of JSA claimants increased between March 2020 and September 2020 as the Covid-19 pandemic took hold. The number of JSA numbers remained high in Burnley until January 2021. JSA numbers have generally declined since this time, although they can still fluctuate.
Provisional and revised data
As Claimant Count data now include Universal Credit claimants, the initial Claimant Count figures are 'provisional'. As Universal Credit figures are revised in the month after their initial publication, the Claimant Count figures are also now revised a month after their initial release.
Updates to the denominators for the Claimant Count proportions
The Claimant Count proportions from January 2021 onwards use the 2021 mid-year population estimates to derive the 16-64 working age denominators. These were published by the Office for National Statistics on 21 December 2022. However, the Claimant Count proportions for the years 2012 to 2021 have not yet been updated with the relevant rebased mid-year population estimates on the NOMIS website. Rebased mid-year population estimates take into account the results of the 2021 Census and are recast from 2012 to 2021 to be more accurate. These were published by the ONS on 23 November 2023. Claimant Count proportions may change once the rebased denominators have been updated on NOMIS.
Important notices:
Claimant Count data revised downwards from January 2016 to December 2018
Owing to an error in the way the Department for Work and Pensions (DWP) counted the Universal Credit element of the Claimant Count, the Claimant Count figures have been corrected downwards from the January 2016 data to the December 2018 data, inclusive. Claimant Count data for this period which was downloaded prior to 19 February 2019 should not be used and the corrected data downloaded again. Claimant Count data for January 2019 onwards should now be correct. The Claimant Count data will however continue to undergo the usual monthly revision, following their initial 'provisional' release (see above).
Further details about the Universal Credit error are contained in the Statistical Notice published by the DWP on the 19 February 2019. A summary is also available on our Universal Credit web page. Please note the Universal Credit element within the Claimant Count only includes those Universal Credit claimants who are required to seek work and be available for work, so the corrected totals for the Claimant Count will be a subset of the corrected totals for Universal Credit as a whole.
Incorrect geographic coding of the Universal Credit element of the Claimant Count from December 2018 to November 2019
A number of claims to the Universal Credit element of the Claimant Count were supplied coded to incorrect locations for the periods December 2018 to November 2019. This has been corrected for December 2019 onwards, but previous periods remain affected. This particularly affects a number of claimants in Northern Ireland who have been incorrectly allocated to areas in Great Britain. The impact on Northern Ireland for December 2019 is an increase of less than 1,000 cases that had previously been distributed across Great Britain. At the UK level there should not be a net effect. As the incorrect postcodes were distributed proportionately across Great Britain, it is thought that the impact on the Lancashire-14 area should be minimal, with about 15 to 25 additional persons for each month from December 2018 to November 2019 in the area.
Missing claims from the January 2021 Claimant Count
Due to processing issues, a small number of Universal Credit claims may not have been included in the January 2021 Claimant Count. This may affect up to 20,000 claims throughout the UK, but the actual number is expected to be substantially fewer. These claims are expected to be included in future Claimant Count releases.
Data
February 2024 (provisional) and January 2024 (revised) Claimant Count data, plus provisional monthly changes, revised monthly and yearly changes - and revised changes from May 2020 and March 2020 (EXCEL 35KB)
Microsoft Power BI report updated with February 2024 (provisional) and January 2024 (revised (final) data on 18 April 2024.
Page web text updated 18 April 2024