16+ self-employment estimates
Background information
The Office for National Statistics (ONS) produces estimates of persons who are self-employed via the Annual Population Survey (APS). These are available to download at the local level via the National Online Manpower Information System (Nomisweb) using the APS variable 'self-employed, employees and non-permanent employment'.
New Office for National Statistics (ONS) web pages, articles and datasets
To assist with the analysis of the impact of the Coronavirus (COVID-19) pandemic on the UK economy and society, the ONS has created a COVID-19 web page that draws together a number of relevant datasets and reports. The web page contains a number of articles and datasets that look at self-employment within the UK that readers may find useful. These include Coronavirus and self-employment in the UK (published 17 April 2020) - an overview of self-employment across the UK, looking at the industrial, occupational, geographic and demographic characteristics of those who are self-employed; Self-employment in the UK and its characteristics dataset (published 17 April 2020); Self-employment by NUTS1 regions dataset (published 17 April 2020); and Self-employment in city regions dataset (published 17 April 2020).
Previous ONS article on self-employment
The ONS also produced an article, Trends in self-employment in the UK (published 7 February 2018) that analysed the characteristics, income and wealth of the self-employed. Although dated, it provides some further insight into self-employment.
Note on the interpretation of self-employment estimates
The estimates analysed in this report are from the year ending December 2004, to the year ending September 2019. Owing to the survey methodology used, the estimates at the district level have wide statistical confidence intervals (the range between which estimates can vary). This means estimates are less reliable and robust at the district level, which reduces their usefulness. For this reason, analysis in this report focusses on estimates for the Lancashire-12 (county council) area and the Lancashire-14 area, which includes the two unitary authorities of Blackburn with Darwen and Blackpool. The statistical confidence intervals for the estimates for these area are still quite wide and caution should be used when interpreting the data.
Self-employment, employees and employment
People in employment can be categorised as employees (if they receive wages or salaries from employers) or as self-employed (if they work for themselves). This categorisation excludes unpaid family workers and people on government-supported training and employment programmes.
Key points
Overview of long-term trends
Self-employment as a percentage of total employment has had an increasing trend since the year 2000 at the UK level.
The estimates analysed in this report are from the year ending December 2004, to the year ending September 2019. The number of people who are self-employed, and the percentage who are self-employed (as a percent of total employment) have also been on upward trends over this period. The main deviation from the trend at the UK level occurred between the year ending March 2008 and the year ending June 2009 when the number of self-employed fell by 88,000 (2.3%), owing to the 2008/09 recession. The self-employment trends within the Lancashire-12 and Lancashire-14 areas have also been upward but have been more volatile, with numbers and percentages fluctuating more often over the period analysed. Within the North West region, self-employment has also been on an upward trend since the year ending December 2004, although less smoothly than at the UK level. The number of self-employed in the region increased for the majority of the survey periods over the during the 2008/09 recession.
Lancashire-12 and Lancashire-14 self-employment numbers
For the year from October 2018 to September 2019, the number of self-employed people aged 16+ was estimated at 85,800 in the Lancashire-12 area and 101,500 persons in the Lancashire-14 area. The Lancashire-12 estimate was the highest in the series (since the year ending December 2004). The Lancashire-14 estimate was the second greatest in the series. The highest Lancashire-14 figure (101,900) in the series was estimated for the year ending December 2016.
Figure SE1: Estimates of 16+ self-employment numbers (without confidence intervals) for the Lancashire-12 and Lancashire-14 areas from the year ending December 2004 to the year from October 2018 to September 2019
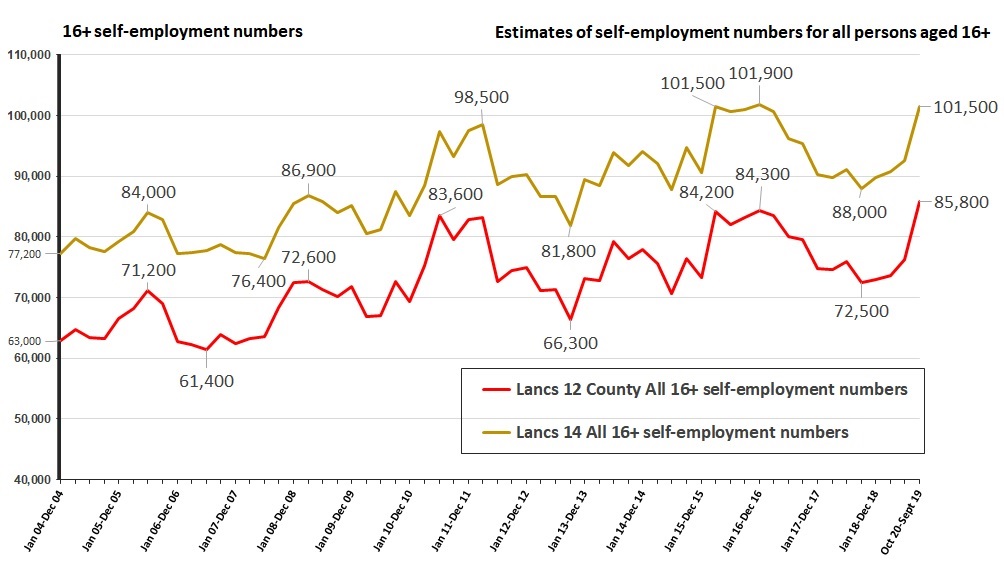
Source: Office for National Statistics, Annual Population Survey via the National On-line Manpower Information System (N.O.M.I.S.). Variable: self-employed, employees and non-permanent employment.
UK self-employment numbers
For the UK, the number of self-employed persons aged 16+ was estimated at 4,942,900 people. This was the highest UK figure in the series (since the year ending December 2004).
Figure SE2: Estimates of 16+ self-employment numbers (without confidence intervals) for the United Kingdom from the year ending December 2004 to the year from October 2018 to September 2019
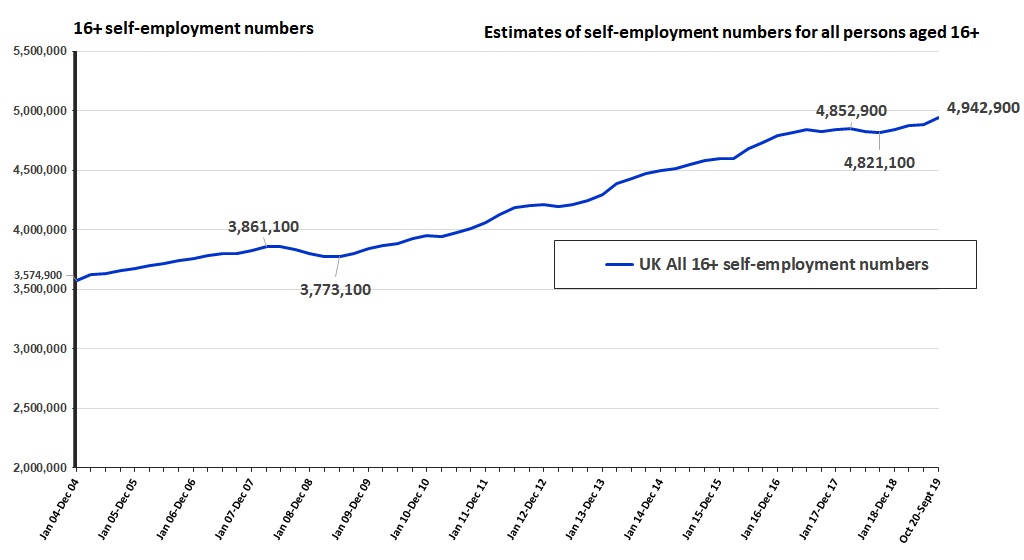
Source: Office for National Statistics, Annual Population Survey via the National On-line Manpower Information System (N.O.M.I.S.). Variable: self-employed, employees and non-permanent employment.
North West self-employment numbers
In the North West, there were an estimated 474,100 persons aged 16+ who were self-employed. This was the highest North West estimate in the series (since the year ending December 2004).
Figure SE3: Estimates of 16+ self-employment numbers (without confidence intervals) for the North West region from the year ending December 2004 to the year from October 2018 to September 2019
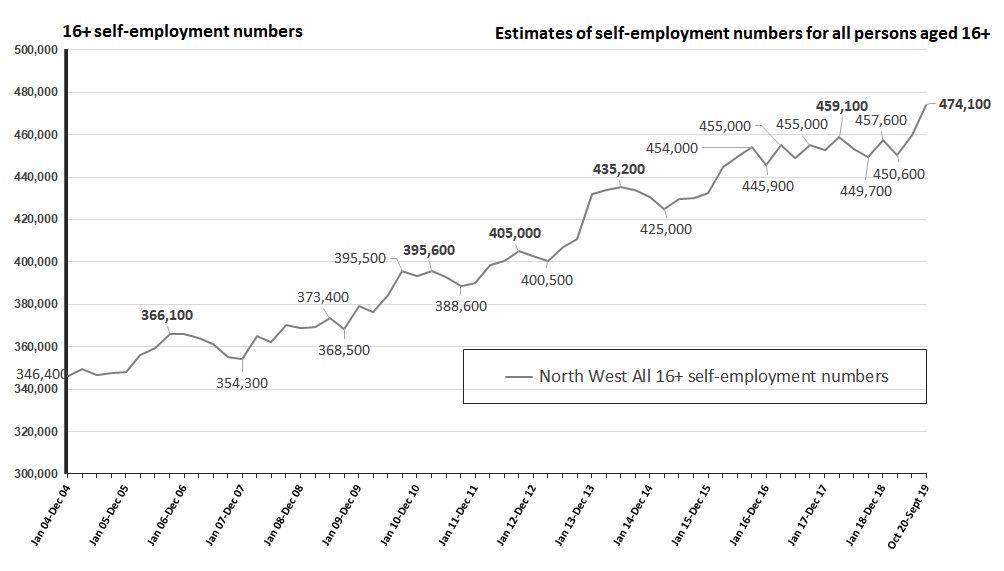
Source: Office for National Statistics, Annual Population Survey via the National On-line Manpower Information System (N.O.M.I.S.). Variable: self-employed, employees and non-permanent employment.
Self-employment as a percentage of total employment for the year ending September 2019
For the year ending September 2019, the estimated number of persons aged 16+ who were self-employed as a percentage of the total number of employed people aged 16+ in the Lancashire-12 area was 15.1% (+/- 1.4 percentage points). For the Lancashire-14 area, the percentage was 14.6% (+/- 1.3 percentage points). Owing to the wide and overlapping statistical confidence intervals associated with these percentages for the Lancashire-12 and Lancashire-14 areas, these percentages were not statistically different to the UK percentage of 15.2% (+/- 0.2 percentage points). They are therefore similar to the UK percentage. See figure SE4.
In the North West, for the year ending September 2019, the estimated number of persons aged 16+ who were self-employed as a percentage of the total number of employed people aged 16+ was 13.7% (+/- 0.6 percentage points). This percentage is statistically lower than the UK percentage of 15.2% (+/- 0.2 percentage points).
Figure SE4: Estimates of 16+ self-employment as a percentage of total 16+ employment estimates (with confidence intervals) for the year October 2018 to September 2019
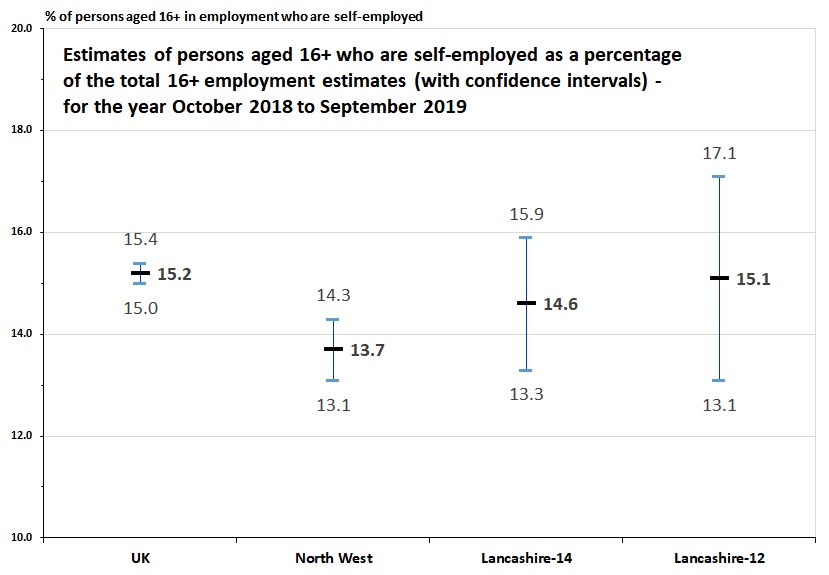
Source: Office for National Statistics, Annual Population Survey via the National On-line Manpower Information System (N.O.M.I.S.). Variable: self-employed, employees and non-permanent employment.
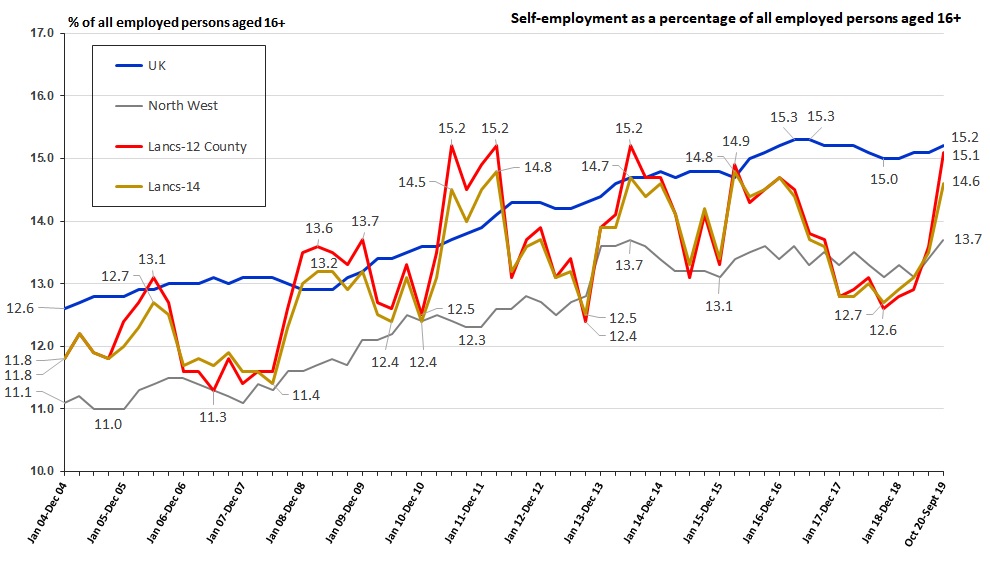
Time-series of self-employment as a percentage of total employment from the year ending December 2004 to the year ending September 2019
Self-employment as a percentage of total employment for persons aged 16+ has had an increasing trend since the year ending December 2004.
At the UK level, the self-employment percentage peaked for the year ending June 2017 at 15.3% (+/- 0.2), dipped to 15.0% (+/- 0.2) for the year ending December 2018, but has since recovered to 15.2% for the year ending September 2019.
The self-employment trends within the Lancashire-12 and Lancashire-14 areas have also been upward but have been more volatile, with percentages fluctuating more often over the period analysed.
In the Lancashire-12 area, self-employment percentage have peaked previously at 15.2% (+/- 1.8) for the year ending June 2011, 15.2% (+/- 1.9) for the year ending March 2012 and 15.2% (+/- 2.0) for the year ending June 2014. More recently, the percentage dipped to 12.6% (+/- 1.8) for the year ending September 2018, but has risen to 15.1% (+/- 2.0) for the year ending September 2019.
The self-employment percentage for the Lancashire-14 area has followed a similar path to that of the Lancashire-12 area. The Lancashire-14 self-employment percentage peaked previously at 14.8% (+/- 1.3) for the year ending March 2012, and 14.8% (+/- 1.4) for the year ending March 2016. Again, more recently, the percentage dipped to 12.7% (+/- 1.2) for the year ending September 2018, but has recovered to 14.6% (+/- 1.3) for the year ending September 2019.
Within the North West, the self-employment percentage has also been on an upward trend since the year ending December 2004, although less smoothly than at the UK level. The North West self-employment percentage peaked previously at 13.7% (+/- 0.5) for the year ending June 2014. More recently, the North West percentage dipped to 13.1% (+/- 0.5) for the year ending September 2018, and the year ending March 2019, but has risen to the peak level of 13.7% (+/- 0.6) once again for the year ending September 2019.
Figure SE5: Estimates of 16+ self-employment numbers as a percentage of total 16+ employment numbers (without confidence intervals) from the year ending December 2004 to the year ending September 2019
Source: Office for National Statistics, Annual Population Survey via the National On-line Manpower Information System (N.O.M.I.S.). Variable: self-employed, employees and non-permanent employment.
Yearly change in 16+ self-employment estimates
UK yearly change
At the UK level, estimated 16+ self-employment numbers rose by 121,800 persons (2.5%) over the previous year. The percentage of self-employed persons aged 16+ in the UK as a percentage of all employed persons aged 16+ in the UK increased by 0.2 percentage points over the year to 15.2% (+/- 0.2%). This is not a statistically significant change. Over the same period, the 16+ employees estimate in the UK increased by 288,200 people (1.1%) whilst the residual 'other' employment category fell by 10,200 persons (down 5.8%). The 16+ total employment estimate therefore increased by 399,800 persons (1.2%) over the previous year.
North West yearly change
In the North West region, the estimated number of self-employed people aged 16+ increased by 24,400 (5.4%) over the previous year. This was greater than the UK percentage increase (2.5%). The percentage of self-employed persons aged 16+ in the North West as a percentage of all employed persons aged 16+ in the region increased by 0.6 percentage points over the year to 13.7% (+/- 0.5%). Again, this is not a statistically significant change. Over the previous year, the 16+ employees estimate in the North West increased by a much lower 1,600 people (0.1%) whilst the residual 'other' employment category fell by 1,100 persons (down 7.9%). The 16+ total employment estimate therefore rose by 24,900 persons (0.7%) on the previous year.
Lancashire-12 area yearly change
Context: The estimated number of self-employed persons, employees, persons in the other category and the total employment figure for people aged 16+ in the local Lancashire-12 area are more volatile that at the UK or regional level. The estimated number of self-employed persons aged 16+ in the Lancashire-12 area had fallen by 11,800 (14.0%) from the previous peak of 84,300, for the year ending December 2016, to the previous low, of 72,500 16+ self-employed persons, for the year ending September 2018.
Yearly change in numbers
Over the previous year, from the year ending September 2018, to the year ending September 2019, the estimated number of self-employed persons aged 16+ in the Lancashire-12 area recovered by 13,300 (18.3%) to 85,800 persons. This was the highest number of self-employed people aged 16+ in the series for the Lancashire-12 area. The estimated number of self-employed persons aged 16+ also increased over the year in the Lancashire-14 area, by 15.3% (13,300), in the UK, by 2.5% (121,800), and in the North West, by 5.4% (24,400 persons).
In comparison, over the previous year, the 16+ employees estimate in the Lancashire-12 area fell by 17,600 people (down 3.5%) and the residual 'other' employment category also fell by 800 persons (down 33.3%). The 16+ total employment estimate for the Lancashire-12 area therefore decreased by 5,100 persons (down 0.9%) over the previous year. This was contrary to the Lancashire-14 area, the North West and the UK, where the total 16+ employment estimates rose by 200 persons (0.0%), 24,900 persons (0.7%) and 399,800 persons (1.2%), respectively.
Yearly change in 16+ self-employed as a percentage of total 16+ employment
The percentage of 16+ self-employed persons as a share of the total number of employed persons aged 16+ in the Lancashire-12 area was 15.1% (+/- 2.0 percentage points) for the year ending September 2019. This was the second highest percentage in the series (ignoring the confidence intervals). Higher percentages (again, ignoring the confidence intervals) were estimated for the years ending June 2011 (15.2%, (+/- 1.8 percentage points)), March 2012 (15.2% (+/- 1.9 percentage points)) and June 2014 (15.2%, (+/- 2.0 percentage points)).
For the Lancashire-12 area, the percentage of 16+ self-employed persons as a share of the total number of employed persons aged 16+ had increased by 2.5 percentage points, from 12.6% (+/- 1.8 percentage points), for the year ending September 2018, to 15.1% (+/- 2.0 percentage points), for the year ending September 2019. This compared to a rise of 1.9 percentage points for the Lancashire-14 area, an increase of 0.2 percentage points at the UK level and a rise of 0.6 percentage points for the North West region.
Lancashire-14 area yearly change
Context: The estimated number of self-employed persons, employees, persons in the other category and the total employment figure for people aged 16+ in the local Lancashire-14 area are more volatile that at the UK or regional level. The estimated number of self-employed persons aged 16+ in the Lancashire-14 area had fallen by 13,900 (13.6%) from the previous peak of 101,900, for the year ending December 2016, to the previous low, of 88,000 16+ self-employed persons, for the year ending September 2018.
Yearly change in numbers
Over the previous year, from the year ending September 2018, to the year ending September 2019, the estimated number of self-employed persons aged 16+ in the Lancashire-14 area recovered by 13,500 (15.3%) to 101,500 persons. This was the joint second highest number of self-employed people aged 16+ in the series for the Lancashire-14 area. A figure of 101,500 self-employed people aged 16+ was also estimated for the year ending March 2016 in the Lancashire-14 area.
In comparison, over the last year, the 16+ employees estimate for the Lancashire-14 area fell by 12,100 people (down 2.0%) and the residual 'other' employment category also decreased by 1,200 persons (down 36.4%). The 16+ total employment estimate for the Lancashire-14 area therefore increased marginally, by 200 persons (0.0%) over the previous year. In terms of total 16+ employment estimates, this was contrary to the fall in the Lancashire-12 area of 5,100 (-0.9%) over the year, but followed the trend of increases estimated for the UK, of 399,800 persons (1.2%) and the North West, of 24,900 persons (0.7%), respectively.
Yearly change in 16+ self-employed as a percentage of total 16+ employment
For the year ending September 2019, the percentage of 16+ self-employed persons as a share of the total number of employed persons aged 16+ in the Lancashire-14 area was 14.6% (+/- 1.3 percentage points). This was the joint third highest percentage in the series (ignoring the confidence intervals). A percentage of 14.6% (+/- 1.4 percentage points)) was estimated for the year ending December 2014. Higher percentages (again, ignoring the confidence intervals) were estimated for the years ending March 2012 (14.8%, (+/- 1.3 percentage points)), March 2016 (14.8% (+/- 1.4 percentage points)), June 2014 (14.7%, (+/- 1.4 percentage points)) and December 2016 (14.7%, (+/- 1.3 percentage points)).
For the Lancashire-14 area, the percentage of 16+ self-employed persons as a share of the total number of employed persons aged 16+ had increased by 1.9 percentage points, from 12.7% (+/- 1.2 percentage points), for the year ending September 2018, to 14.6% (+/- 1.3 percentage points), for the year ending September 2019. This compared to a rise of 2.5 percentage points for the Lancashire-14 area, an increase of 0.2 percentage points at the UK level and a rise of 0.6 percentage points for the North West region.
Page updated 23 April 2020